Public Health

Johnson's Gamble: hoping the COVID-19 chain stays broken

There is no gambling like politics. 

Benjamin Disraeli UK Prime Minister 1868 and 1874-1880

The British Government is gambling. Cases of coronavirus are doubling every 10 days in England and hospital admissions have risen over 50% in the past week alone. Yet today the government is set to lift restrictions, from social distancing to mask wearing, in a bid to restore normality to the economy. Prime Minister Boris Johnson has said “if not now, then when?” with regard to lifting restrictions. 

The new UK Health Secretary Sajid Javid has warned that the country is entering “uncharted territory” as the last COVID-19 restrictions are likely to be removed by July 19th and UK daily cases could reach an unprecedented 100,000. Neil Ferguson, a leading epidemiologist at Imperial College London and government modeller on COVID-19 called this a “slight gamble”. This article is not about arguing for perpetual lockdown. It is rather an attempt to explore what that gamble means using the data available. For it is a gamble. And, if it goes wrong, more than a “slight one”.

At the peak of the second wave on 29th December 2020 81,517 people tested positive in one day. Of these 3,249 (3.99%) were admitted to hospital and 1,939 (2.38% of the daily cases) were in hospital requiring mechanical ventilation. 656 people (0.8% of the daily cases) died. This was at the start of the UK vaccination programme. On 3rd July 2021 22,230 tested positive for SARS-CoV-2. 386 (1.74%) were hospitalised, 327 people (1.47%) required mechanical ventilation and 20 (0.09% of the daily cases) died.


A key challenge for the vaccination campaign and a mantra often quoted in the media is to ‘break the chain’ of hospitalisations and death. Whilst a vaccinated person may still fall unwell due to COVID-19 the point is to prevent serious illness which requires hospitalisation. These data suggest that the chain has been broken. Sajid Javid’s gamble is that this stays the same. It may not. 

The Delta variant (previously called B.1.617.2.) was first identified in India in December 2020. It is now the dominant strain in the UK. Delta is 50% more contagious than Alpha (previously called B.1.1.7 or the Kent strain) which emerged in the UK in September 2020 and was itself 50% more contagious than the original SARS-CoV-2 virus. This means that while a patient infected with the original coronavirus strain could be expected to infect about 2.5 other people, someone infected with the Delta variant in the same environment would pass it on to 4.5 or 5 people. 

By 3rd July 63.8% of the UK adult population had had two vaccine doses. Current data suggest that the Pfizer-BioNTech vaccine is 96% effective against hospitalisation after 2 doses and the Oxford-AstraZeneca vaccine is 92% effective against hospitalisation after 2 doses. This is obviously good news and suggests that nearly two-thirds of the UK adult population have >90% protection from hospitalisation due to Delta. However, this may change. 

Viruses, like all life on Earth, use a genetic code. A genetic code is a series of letters. Whenever a genetic code is replicated there may be ‘spelling mistakes’ much as we might make a mistake copying out text and one or more letters may be replaced with another. This is how mutation happens. Sometimes these mutations may result in disease. Sometimes they may convey an advantage. This is how virus variants such as Alpha and Delta emerge. Mutations that convey an advantage (such as greater infectivity) mean that the virus particles with that mutation are more likely to be spread. Although SARS-CoV-2 seems to have a relatively slow rate of mutation compared to other viruses such as influenza, the more chances it has to spread and replicate the more chance it has to mutate. If the government allows a situation where 100,000 people a day in the UK are contracting SARS-CoV-2 they are permitting a fertile environment for new variants. The gamble is that a new variant won’t emerge against which the vaccines aren’t as effective and the chain of hospitalisations becomes unbroken. This is why Pfizer/BioNTech are trialling a version of their vaccine which targets the Delta variant as well as publishing guidance to add a third ‘booster’ vaccine six to twelve months after the two-dose regime. Boosters and new versions may become the norm. There is also the chance that a variant may emerge in other parts of the world with much lower rates of vaccination (currently only 2% of the population of Africa have received two doses of COVID-19 vaccine).

The data for 3rd July projected for 100,000 daily cases suggests 1,740 hospital admissions a day and 90 daily deaths. All less than the data for 29th December. However, if a new variant emerges which pushes us back to the data for 29th December then with 100,000 daily cases the UK would see 3,990 hospitalisations, 2,380 patients on ventilation, and 800 deaths. Nearly ten times the number of deaths based on 3rd July data. This is the government’s gamble: that the current modelling continues and a new variant doesn’t disrupt the benefits of vaccination.

The British Medical Association reports that between March 2020 and April 2021 there were 3.5 million fewer elective procedures and 22.27 million fewer outpatient attendances. The total number of patients waiting over 18 weeks for treatment has increased to 1.8 million.

This clearly is not sustainable. Sajid Javid faces a big challenge to get the NHS back to what President Biden would call normalcy. But even that would not be enough. The COVID-19 pandemic followed the 2018/19 winter when all non-emergency and non-cancer care was cancelled for a month. The NHS needs more than claps if it is going to be able to focus on non-COVID-19 care. The ramifications of Johnson’s government’s gamble are huge. Let’s hope it pays off.

Give Me Liberty or Give Me Death: The liberal case for lockdown

Liberty Leading the People by Eugène Delacroix commemorating the July Revolution of 1830 which toppled Charles X of France. A female personification of liberty is shown leading the people. In France, this figure has come to represent the French Republic and is called Marianne. I took this photo in the Louvre in 2017.

“Give me liberty or give me death”

Patrick Henry (1736-1799) American politician


A group of influential backbench Conservative MPs calling themselves the ‘COVID Recovery Group’ have put pressure on Prime Minister Boris Johnson to lift lockdown restrictions by April. They argue that if the vaccination programme continues as planned there would be 

“no justification for legislative restrictions to remain.”

Their leader Mark Harper argued that ‘vaccine = immunity from lockdown and restrictions”. Once again there are arguments about ‘the cure being worse than the disease.’

Mark Harper’s tweet claiming that the vaccine means immunity from lockdown.

The British tabloid media have been predictably considered and reserved when it comes to reporting the end of lockdown.


On an appearance on the BBC’s Andrew Marr Show Harper claimed the CRG was following the science in their announcement. The government instead has pledged to follow the data, not dates in their own planned end to lockdown in England by 21st June 2021. The purpose of this blog is not to judge who is correct between the CRG and the government but instead to have a look at lockdown in the context of liberalism. 


Elections cancelled, emergency legislation, movement restricted, schools closed and jobs furloughed. This has not been a great time for liberty.  But is lockdown completely illiberal? Does being a liberal automatically mean opposing lockdown? If we explore the history of liberalism we find that, actually, following the evidence and placing restrictions to avoid harm is entirely within the scope of liberalism. 

For some, ‘liberal’ is an insult aimed at the ‘woke’ and ‘cancel culture.’  Some wear the label proudly, marking them out as a supporter of ‘free speech’ and ‘common sense’ against the ‘woke cancel culture.’

A radical idea

Liberalism is a radical idea. Ian Dunt, author of ‘How to be a Liberaldescribes liberalism as an idea at the centre of which is the belief that people are individuals with their own freedom and should be treated as such. Therefore, pointing to ‘elites’, ‘us vs them’, class warfare or identity politics are, by definition, illiberal. A liberal would not presume to know you based on where you were born, what you looked like, what body parts you did or didn’t have, to whom you did or didn’t pray or whom you loved.  It does not pretend that human-beings form homogenous blobs. It does not speak about ‘the will of the people’ or about putting one group or one country above another. In short, it is everything that populism is not. Trump, Brexit, Viktor Orbán’s Hungary, Andrzej Duda’s Poland, Modi’s India, China, Jair Bolsonaro’s Brazil and Putin’s Russia are all fine examples of how not to be a liberal.

In the United Kingdom, the torch of liberalism has been carried by several parties over several centuries. In its spirit, UK governments abolished slavery, traded freely, established universal suffrage and free education, introduced the welfare state, decriminalised homosexuality, legislated for reproductive rights for women, statuted against discrimination based on gender or race, removed the death penalty, joined the European Economic Community, devolved power to its member nations, created the minimum wage and brought about first civil ceremonies and then fully equal same-sex marriage. Truly a radical idea. 

Circles to square

Of course, if you take the idea of individual freedom you can go off in many different directions. Classical liberalism in the UK was interested in increasing suffrage, the elimination of corruption in democracy and free trade. Social liberalism was born out of a desire to increase freedom from poverty. Neoliberalism, which for many now means liberalism, dominated from the financial deregulation of the 1980s and increased freedoms for business. There is now green liberalism, to provide freedom from climate change and to the project the environment. 

Under the banner of freedom, Margaret Thatcher and Ronald Reagan felt liberalism meant rolling back the state and freeing up the markets. For John Maynard Keynes liberalism meant the state actively involving itself in the market to steady the boom-bust cycles. The Liberal Party of the United Kingdom would, within a century, encompass laissez-faire economics under William Gladstone, the beginnings of the welfare state under Herbert Asquith and David-Lloyd George and, through the famous report penned by Liberal peer William Beveridge, provide the inspiration for the socialist post-war Labour government of Clement Attlee. 

All political factions are by nature a coalition and liberalism is perhaps the broadest of churches. This means contradictions. The founding fathers of the United States would enshrine the inalienable right to “life, liberty and the pursuit of happiness” yet have no problem with the idea of one human-being owning another. Sir Winston Churchill proclaimed “long live the cause for freedom” yet when it came to the idea of other country’s independence would say “I have not become the King's First Minister in order to preside over the liquidation of the British Empire.” Margaret Thatcher’s government would seek to free people’s ability to make money yet passed Section 28 banning teaching  “the acceptability of homosexuality as a pretended family relationship.”

If we take liberalism to its extreme we reject any form of government. This is where we find anarchism and libertarianism. And yet more contradictions. For the anarchist Pierre-Joseph Proudhon “all property is theft.” For the libertarian Ayn Rand “a free mind and a free market are corollaries."  It is the libertarian wing of the Conservative Party which makes up the CRG.  They campaign for liberty against lockdown. Yet they also were the MPs most willing to support the absolute removal of the rights of UK citizens to live, work and trade without barriers with the European Union. 

Essentially then when it comes to liberty clearly there are a lot of circles to square. 

Liberalism and logic

Liberalism has its roots in the Age of Enlightenment. Also known as the Age of Reason, this period lasted from the late 17th to early 19th century. Following the English Civil War and execution of Charles I in 1649 the restoration of the monarchy in 1660 under Charles II saw a return to absolute rule. This prompted a rethink of how society should work. This was a time of Sir Isaac Newton, of encyclopaedias and the scientific method. This focus on evidence and logic shaped philosophy. 

John Locke.

Thomas Hobbes.

Jean-Jacques Rousseau.

John Locke (1632-1704), considered the father of liberalism, was a physician and empiricist. He believed that human-beings came to decisions based on observation and rationality, just as a scientist like Sir Issac Newton studied the world. In 1689 he published Two Treatises of Government in which he argued against the divine right of kings to rule without question, for religious tolerance and the separation of church and state and for the innate rights of the individual to life, liberty and property. The role of government was to respect those rights at the risk of being replaced if they did not.  

Locke of course was not alone. His publication reflected the 1651 work Leviathan by philosopher Thomas Hobbes (1588-1679) which called for a social contract between the state and the individual to unlock freedom for all. The Genevan Jean-Jacques Rousseau (1712-1778) would similarly point to the role of government to ensure the innate freedoms of its citizens. In England through the Bill of Rights in 1689, the American Revolution of 1765-1783 and the French Revolution of 1789-1799 freedom and the rights of people to have a say in how they were governed were starting to take hold.

But Locke illustrates an important point when it comes to lockdown. For Locke, knowledge was not something divinely dispensed at birth but something gained through experience and, through acquiring knowledge, an individual became happier and freer. I very much doubt he would have any truck with a politician claiming to have ‘had enough of experts’. Locke would have supported looking at the evidence and using reason. 

Freedom and the Harm Principle

Does being free mean having the ability to determine your own future and life? Or does it mean that there are no obstacles being placed in front of you? The first definition describes positive liberty. This is basically the foundation of liberal democracy: individual citizens each avowed with the power to shape their shape. Neither Hobbes and Locke had any problem with a government having power over people. Hobbes argued that if completely free mankind would be cruel to each other with the strong dominating the weak and so a government was needed to prevent this. Locke however felt man was inherently good and that a government, with the consent of the people, should have the right to govern in the common good.

The second definition describes negative liberty. This is the creed of the libertarian: government is the problem and we should all be able to do what we want. If we accept that to be free is to be unconstrained then lockdown has to be illiberal. But let’s try to explore this thought process. Are drink-driving laws illiberal? If we removed that constraint and people had the right to drive whilst under the influence what about the freedom of a pedestrian they might hit? As much as lockdown impairs the right of a young, healthy person to carry on living their life, what about the rights of a vulnerable, older person to whom the younger person might pass on the virus? Liberalism, again, has an answer.

John Stuart Mill.

John Stuart Mill (1806-1873) served as a Member of Parliament for the Liberal Party from 1865-1868. He was a polymath raised from childhood on philosophy and travel. He supported the abolition of slavery in America and the equal rights of women. In 1859 he published On Liberty in which he explored the extent to which a government could restrict the right of the individual. In this essay he articulated a position known as the harm principle:

“The sole end for which mankind are warranted, individually or collectively, in interfering with the liberty of action of any of their number, is self-protection. 

That the only purpose for which power can be rightfully exercised over any member of a civilized community, against his will, is to prevent harm to others. 

His own good, either physical or moral, is not sufficient warrant. 

He cannot rightfully be compelled to do or forbear because it will be better for him to do so,

 because it will make him happier, because, in the opinion of others,

 to do so would be wise, or even right.… 

The only part of the conduct of anyone, for which he is amenable to society, 

is that which concerns others.”

MIll did not see harm as something you do to yourself but to others. If you want to drink excessively, go do it. If, however, you decide to then get behind the wheel of a car and endanger others then the state should step in and intervene. 

But what about a complex system such as the National Health Service where all healthcare is provided via the joint taxation of citizens? It could be argued that it is a form of harm to others if the decisions you made with regard to your health result in requiring healthcare resources that you might not otherwise need to use. 

If, through risky actions, an individual is exposed to COVID-19 and becomes infected we could argue that that is their decision. If that individual then passes the disease to another, more vulnerable person then that is harm. If that individual then requires a hospital admission and thus helps stretch finite resources that will have an impact on others. If hospital capacity is reached what then of the rights of another patient who’s had a heart attack or who needs emergency surgery? This would prevent the positive liberty of others from being realised. 

The UK government has faced criticism over an initial delay in lockdown and then early easing of which led to further restrictions being necessary. Of course political debate and differences of opinions are a cornerstone of a liberal democracy. Liberalism is about the right to differ. But to ignore evidence in favour of political principles at the risk of public health is not liberalism. Listening to evidence and reason and putting aside individual liberty to protect others is entirely within the liberal tradition. 

In other words when it comes to COVID-19 you don’t have to choose between liberty or death. A liberal would tell you that you can have both. 

Lies, Damn Lies and Statistics: The Media's Misuse of Numbers during the Pandemic

This week the respected German broadsheet Handelsblatt published an article claiming that the German government had leaked that the Oxford University/AstraZeneca vaccine only gave pensioners eight percent protection against COVID-19. They hastily released a clarification: the article resulted from a mishearing of a statistic: that 8% of the subjects in the AstraZeneca efficacy study were between 56 and 69 years of age. From this mishearing came a snowballing and a potentially damaging piece of misinformation

Misinformation comes in many forms. It’s easy to spot the obvious lies: that COVID-19 doesn’t exist, that it’s spread by 5G towers, that Bill Gates is trying to fill us with microchips.

Misinformation based on a misreading of statistics may be a simple mistake, as with Handelsblatt, but others may be much more cynical: that we are overreacting to a disease with only 1% mortality, that the NHS occupancy is much lower than normal and that there hasn’t been an increase in deaths compared to previous years. These lies are seductive and often used to justify more myths: that lockdowns don’t work, that lockdown has caused a rise in suicides or that wearing masks doesn’t work.  It’s time to challenge the misuse and misrepresentation of statistics.  

Let’s start with that line about how we are overreacting to a disease with only a 1% mortality rate. This is actually wrong as a statistic. The World Health Organisation COVID-19 Dashboard reports a mortality rate of 2.1%. But for the sake of argument let’s run with that figure of 1%. A  mortality rate of 1% doesn’t sound like much at all. It’s far less than the mortality rate of Ebola (50%) and another disease caused by a coronavirus, MERS (35%). 

But that’s not the point with a proportion. It’s not the percentage itself that’s important it’s what it’s a percentage of.  If you have 100 people infected that means only one person dying - not a big number at all. But if 100,000 people are infected that means 1,000 dying. Not an insignificant number. On the 8th January 1,035 people died in the UK within 28 days of testing positive. To put that in context 67 Britons died during the September 11th terrorist attacks. The right-wing media rightly admonish terriorism and honour those who died in terror atrocities. However, on 8th January COVID-19 killed 1545% the number of Britons murdered on September 11th. In total over 100,000 people in the UK have died from COVID-19. Double that killed by the Blitz.

This focus on 1% mortality also ignores other basic facts of COVID-19. Whilst ‘only’ 1% of patients with COVID-19 will die about 15% will need hospital care. About 5% of those infected will need to come to critical care (ICU). Once again, if 100 people are infected that’s 15 coming to hospital and 5 needing critical care. If 100,000 are infected that’s 15,000 needing a hospital bed and 5,000 needing ICU.  That’s without mentioning the impact of ‘long COVID’. This is not a disease where just 1% of people die and 99% have the sniffles and are fine. Painting it otherwise is a false dichotomy and a lie. 

Of course the impact of the pandemic on non-COVID-19 patients has rightly been brought up. However, this again misses the point. If a hospital’s capacity has been taken up with patients with COVID-19 then that means there is no space for patients who’ve had a heart attack or need emergency surgery. The NHS would cease to function.      

The other lie which is peddled is that because a percentage of ICU beds being used is less than the same time in a previous year this means that critical care is not as busy. 

This once again is a misunderstanding of proportions. It’s not just the percentage of critical care beds being occupied it’s the total of critical care beds available. 25% is less than 50%. But it’s a simple fact that 25% of 200 is the same as 50% of 100. Just looking at the percentage ignores the fact that ICU capacity has been increased in response to the pandemic. For example, in March 2020 Northwick Park Hospital in North West London increased their critical care capacity from 22 to 52 beds, an increase of 236%.  Even if the percentage of beds occupied is lower if the number of beds has gone up this still represents a greater demand on the NHS. 

Northwick Park is part of London North West University Healthcare NHS Trust. A look at the monthly situation report on the number of available and occupied Critical Care beds on the last Thursday of the month for 2020 tells us that at the end of January last year London North West University Healthcare NHS Trust had 33 adult ITU beds in total of which 28 were occupied. That’s 85% occupancy.

If we look at the Urgent and Emergency Care Daily Situation Reports 2020-21 we see that on 11th January 2021 London North West University Healthcare NHS Trust had 102 adult critical care beds of which 78 were occupied. That’s 76% occupancy.

So if we look at occupancy alone London North West University Healthcare NHS Trust had a smaller percentage of their adult critical care beds occupied on January 11th 2021 than at the end of January 2020. But because they had massively increased their critical care capacity the number of beds actually occupied was much larger: 78 compared to 28 or an increase of 279%. Focusing on occupancy alone ignores the true picture of the pandemic.

Another line often taken has been that “we should just use the Nightingale Hospitals”. These are seven hospitals set up in England as well as one each in Scotland, Wales and Northern Ireland  in order to create extra capacity for COVID-19 patients.  

This is misleading again. It’s all well and good to set up a hospital, another thing entirely to run it. Even in April 2020 there were warnings that the NHS could not staff the new hospitals. We could fill the hospitals with patients but without doctors, nurses and other healthcare staff they won’t be looked after. NHS staffing shortfalls pre-exist COVID-19 but the pandemic has exposed how threadbare the situation is. 

Another theme in the misuse of statistics has been to claim that mortality this year has been no higher or even less than in recent years. A rather egregious example of this was a Daily Mail article from 20th November 2020 entitled ‘What they don’t tell you about COVID’ which claimed the number of weekly deaths is currently “barely any higher” than the maximum level from the previous five years. This was wrong and torn apart both on Twitter and by Full Fact.

The figures came from a character called ‘Statistics Guy’ on Twitter who joined in April 2020. He claims to “do uk statistics for ordinary people. cutting (sic) through the waffle on your behalf”. In calculating the figures for the Daily Mail he missed out data which would have changed his conclusions as well as ‘adjusting’ figures for population growth. This was bizarre: as though the basic number of COVID-19 deaths can be negated because there are more people in the UK than in previous years. 

A more recent example on 8th January, the same day that 1,035 people died of COVID-19 in the UK, former pathologist John Lee claimed on Julia Hartley-Brewer’s talkRADIO show that:  

“We're seeing mortality that's well within the envelope of what normally happens this time of year. The last five years have been a below average number of death years if you look at the ONS data anyway compared to the last 27, which is how far their data go back...we’re below the average point of the deaths at this time of year...”

This again was torn apart by Full Fact. The five-year average is standard practice when looking for excess deaths so by not using it seems that Lee was trying to cherry-pick the data. Regardless, even adjusting for population he was wrong on both the 27-year and 5-year average. 

* * *

"Figures often beguile me...in which case the remark attributed to Disraeli would often apply with justice and force: 'There are three kinds of lies: lies, damned lies, and statistics.'"

Mark Twain

Mark Twain has been proved right many times over, especially during the COVID-19 pandemic. Statistics sound good and, superficially at least, given credence to an argument. We should be careful when we hear or read a statistic to think about what’s actually being shown. So too should those of us speaking far outside our arena of expertise. Toby Young, a right-wing journalist of no scientific or medical training, has recently had to apologise for a 'significantly misleading' column for the Daily Telegraph in which he claimed the common cold could provide "natural immunity" to COVID-19. Let’s remember Mr Twain. There is nothing more contagious than a lie. And no more dangerous a lie than a statistic. 

The very simple reason why masks are safe to wear (and everything you've read which says they aren't is wrong)

Masks are safe to wear. Thanks to analytics I’m aware that only about a third of readers of my posts actually read them in their entirety. So before you go I want you to know: masks are safe to wear. Whatever you may have read online, they are safe. If that’s all you take away that’s enough for me. My ego can take it. If you’d like to know more then please read on. It’s really very simple: size matters.

I’ve argued before that if you get 100 scientists in a room, broadly speaking, you’ll get consensus. The fact that scientists agree isn’t some grand Illuminati scheme; it’s because they follow a scientific method in the pursuit of replicable results. Conspiracy theorists do not. Get 100 conspiracy theorists together and you’re likely to get 100 different stories. They’ll agree that there’s a conspiracy but not on which one. It was the Mafia. No, it was the CIA. No, it was the military-industrial complex.

So it is with mask conspiracy theories. On the one hand, you may have seen that masks offer no protection against the SARS-CoV-2 virus because the holes in them are too big to block the virus. On the other, you may have read that the masks stop carbon dioxide from being breathed out by wearers result in the build-up of carbon dioxide, a lack of oxygen being breathed in. You may have heard of a supposed epidemic of people ill with hypercapnia (too much carbon dioxide) or hypoxia (lack of oxygen). Or you may have heard that they are causing dangerous infections due to build-up of bacteria. 

It is nice of them to offer a choice. All are wrong. This is why.

An individual SARS-CoV-2 virus is tiny. Each particle is 100 nanometres across. Outside of the human body, these particles are called virions, biologically inert showing no signs of life. Inside a human body, the particles infect cells, hijacking the cells’ genetic material with their own. It’s this process which is called a virus. So, one conspiracy goes, 100 nanometres is too small for surgical masks to block so what’s the point?

However, SARS-CoV- 2 virions don’t exist in isolation. They are suspended in droplets of respiratory secretions much larger than the virions themselves. It’s these droplets which surgical masks are designed to block. And we know exactly what size droplets they can block thanks to research. 

COVID-19 is not the 21st century’s first pandemic. 

So-called ‘avian flu’ or H5N1 was the focus of the international community at the turn of the century. Here in the UK, this culminated in an outbreak at a turkey farm in early 2007. In the spring of 2009, a novel H1N1 influenza virus caused a pandemic known as ‘swine flu’ killing 151,700–575,400 people worldwide. 

A surgical mark, Source: Shutterstock

It was against this backdrop that the Health and Safety Executive (HSE) in the UK investigated the protection that different masks afforded the wearer against droplets containing airborne virions. This included surgical masks. 

They focused on the size of droplets a surgical mask could stop. The key distinction was droplets greater or less than 5 micrometres, or 5000 nanometres across. Droplets larger than 5000 nanometres tend to drop out of the air quickly due to their weight. Droplets smaller than 5000 nanometres are called aerosols and are more likely to remain airborne and represent a greater infection risk. 

While they found that respirators could block 100% of aerosols they found only a 6 fold reduction by surgical masks. They concluded that surgical masks should provide “adequate protection against large droplets” they “might not sufficiently reduce the likelihood of transmission” from the smaller aerosols. 

In other words, the holes in surgical masks were found to be too big to stop droplets smaller than 5000 nanometres across. This is why surgical masks are not recommended to be worn for aerosol-generating procedures such as intubation which make those smallest droplets. 

Yet conspiracy theorists would have you believe that a mask which can’t stop droplets 5000 nanometres in diameter somehow does stop carbon dioxide molecules which are only 0.334 nanometres across. Or oxygen molecules which are only 0.299 nanometres from end to end. It is a physical impossibility. 

An FFP3 mask, Source: Shutterstock

So that’s surgical masks but what about respirator masks? Surely the FFP3, worn by medical staff during aerosol-generating procedures must be a risk? 

Of course not. True, the pores in respirator masks are smaller than in surgical masks. FFP3 masks are designed to filter 99% of all particles bigger than 600 nanometers. Small enough to stop aerosols, which is why they are worn by health workers for aerosol-generating procedures, but still much bigger than carbon dioxide and oxygen molecules. 

Cloth masks, Source: Shutterstock

And what of cloth masks? The filtration effect of non-medical cloth masks is less than surgical masks or FFP3 masks. Therefore, for the reasons we’ve already looked at it would be impossible for cloth masks to cause hypercapnia or hypoxia. They are safe to wear. 

However, a study in the British Medical Journal in 2015 advised that due to “moisture retention, reuse of cloth masks and poor filtration” cloth masks should not be used by healthcare workers. This is not surprising: cloth masks are not as good at filtering the air as surgical masks or FFP3 masks and so should not be worn by healthcare workers looking after patients in a high-risk environment. 

For non-medical use such as going to the shops or on public transport however, a cloth mask is perfectly fine. The idea is that they trap the droplets spread by the wearer when they talk, cough or sneeze. This means they protect other people from the person wearing the mask. The CDC published a study in November 2020 which recommended cloth masks as suitable for community use. They advised that they should be washed regularly.

So everything you have read about masks causing hypoxia or hypercapnia is wrong. Size matters.

What about the conspiracy theory that masks can cause infections in the wearer through the build-up of bacteria? Again, wrong. There is no evidence of masks causing infections in the people wearing them. Why would there be? You’re wearing a mask. Unless you’re borrowing it (don’t) any saliva etc. on the inside is yours. If you have an infection and then put a mask on you’ll still develop symptoms but, of course, the mask didn’t cause that. 

There is evidence of bacteria build-up on the outside, however. This makes sense. Surgical masks aren’t made up of some special anti-bacterial material. Latex gloves are the same. Although they’re a physical barrier they don’t actually repel bacteria. If you touch a surgical mask you’ll transfer any germs on your hands. It’s been shown that surgical masks can pick up significant bacterial growth on the outside correlating with bacteria in the environment. It’s been recommended that surgical masks should be changed every 2 hours for this reason. If you’re wearing a mask it needs to be regularly changed and any touching reduced to a minimum. Same as if you’re wearing latex gloves: they still need to be changed regularly or washed.

So there you have it. Masks combined with other social distancing measures have been shown to reduce the spread of SARS-CoV-2. As shown here masks are also completely safe. Whatever you may have read online, they are safe. You should wear one.

Answering Your Questions about the COVID-19 Vaccines

From Shutterstock

The United Kingdom has approved the BioNTech/Pfizer vaccine and the very first people in the world have received their first jabs against COVID-19. The end should be in sight of this pandemic. Following previous posts, I’ve been asked a lot in person and online about the COVID-19 vaccines and vaccination in general. Here I’ve tried my best to answer them. Hope you find them useful. Please note although I am a doctor I am not involved in any of the trials mentioned.

* * *

How does the immune system work?

The human immune system is divided into two parts: the innate and adaptive. We’re born with the innate immune system whilst the adaptive is something we develop. The innate immune system is broad while the adaptive is specialised. The innate immune system consists of cells (phagocytes) which ‘swallow’ and destroy bacteria, viruses and other disease-causing organisms (pathogens). This happens quickly after being infected. These cells break up the pathogens into smaller parts which they then display on their surface. Cells called helper T cells ‘read’ these smaller parts and start the adaptive immune response. Cells called B lymphocytes are activated and turn into plasma cells which start producing antibodies. These are proteins designed to specifically counteract one particular pathogen. They fit around proteins called antigens on the surface of the pathogen. After doing this they stop the pathogen functioning, in the case of viruses this can stop them being able to invade cells, and helps the phagocytes find and swallow them. The helper T cells also activate killer T cells which find and destroy cells which have been infected by the pathogen. The adaptive immune system as a result is slower. But it lasts. Both B and T cells retain ‘memory’ of that pathogen so if we are infected again they can start working immediately to destroy it. It’s this memory which is the basis of vaccination.

How does a vaccine work and how long do they take to produce?

Even in the early days of what we would recognise as Medicine people noticed that patients who survived some infections, such as smallpox, would never suffer the disease again. The concept of inoculation was based on this. Dried smallpox pustules were scratched into the skin or blown up the nose of patients. The majority of people would develop mild symptoms but then be immune to smallpox. Some patients would develop full-blown smallpox and so a safer alternative was sought. The story of Edward Jenner, the English country physician, is famous. He noticed how dairymaids who contracted cowpox, a mild disease, never suffered from smallpox. He scratched cowpox pustules into the arms of a boy called James Phipps who then developed a fever. Once Phipps recovered Jenner repeatedly injected the boy with smallpox pus. The boy showed no symptoms. The process was called vaccination from the Latin word for cow.

Vaccines usually consist of a weakened, non-infectious version of a pathogen or a part of a pathogen. The idea is to activate our adaptive response (which is why following a vaccine we often feel unwell) and so give us that ‘memory’ ready to fight the pathogen in the future.

But this takes time. Vaccines traditionally take about 10-years to produce.

You can hear me talking to my Pharmacist colleague Kunal Gohil about the immune system and the process of vaccine production here:

COVID-19 Part Four: The search for a cure — Take Aurally
A feature of the COVID-19 pandemic has been the rush to find the magic bullet to defeat it. Under the heading of…www.takeaurally.com

So how did we make the COVID-19 vaccines so quickly?

The Pfizer, Moderna and Oxford vaccines have all been made using new methods.

The Pfizer and Moderna vaccines use messenger RNA. Human beings (like most life on Earth) store our genetic material as DNA. DNA is like a blueprint for making proteins. The blueprint is ‘read’ and something called messenger RNA (mRNA) is made. The mRNA is used by our cells as a code to make the proteins which we use to live.

The Pfizer and Moderna vaccines use mRNA that codes for the spike protein on the COVID-19 virus wrapped in small fatty molecules to stop the mRNA from being destroyed by our enzymes. The mRNA is read by our cells who then make the protein to be detected by helper T cells.

The Oxford vaccine uses a harmless virus which causes the common cold in chimpanzees called an adenovirus. The adenovirus was altered to express the COVID-19 spike protein. The end result is the same: our helper T cells detect the spike protein and kick off our adaptive immune response.

Although these vaccines have been produced in response to a disease we’ve only known about for a year, the technology behind them has been decades in the making. New ways of making vaccines, called platform technology, have been sought for over twenty years as a way of being able to provide new vaccines quickly to fight a new disease. While the vaccines feel like they’ve been produced overnight they’re actually the result of lots of preparation. In January 2020 the SARS-CoV-2 virus was first identified and its genetic sequence was analysed and published by Chinese scientists. This meant work could begin immediately to produce vaccines using the platform technology. It also puts paid to the idea that the virus was a Chinese conspiracy.

The other reasons are due to the huge amounts of money, both public and private, given to fund the trials as well as the number of altruistic volunteer participants. Traditionally, companies would wait until the end of their trials to publish data but instead, they released ‘rolling’ data ‘as it happened’. In the case of BioNTech/Pfizer they were able to publish data in October. Scientists and clinicians at the UK Medicines and Healthcare products Regulatory Agency, (MHRA) were then able to work day and night to scrutinise over 1000 pages of results.

How do we know these vaccines work?

BioNTech/Pfizer enlisted 43,448 people. 21,720 were given their vaccine and 21,728 were given a placebo. 170 participants went on to catch COVID-19. 162 (95%) were in the placebo group. Only 8 (5%) were in the vaccine group. This is where the figure of 95% effectiveness comes from.

Moderna enrolled roughly 30,000 people and again divided participants into those receiving the vaccine and those receiving a placebo. 95 participants in total caught COVID-19, 90 in the placebo group and 5 in the vaccine group. This again gives us a figure of 95% effectiveness. 

Oxford-AstaZeneca enrolled over 11,000 people in the UK and Brazil who were either given the vaccine or a placebo. The vaccine group was further divided between people receiving two full doses and those receiving a half dose followed by a full one. The two full vaccine dose regime was found to be 62% effective in preventing COVID-19 while the 1.5 dose regime was found to be 90% effective. The reason for this difference is not yet understood.

Will the new variant make the vaccine pointless?

Genetic code consists of letters. Whenever genetic material replicates those letters are copied. From that copy, a new genetic code is written. This is called transcription and translation. As when we copy and type out text the odd mistake can happen. Letters can be replaced for another. This can lead to mutations. These can be bad and lead to mistakes which cause cancer. Sometimes the mutation gives the organism a benefit over other organisms, making them more likely to survive and breed and so pass on that advantage. This is the basis of evolution through natural selection. 

Viruses are particularly prone to mutation because of how frequently they replicate. Overall, the SARS-CoV-2 virus has shown a low rate of mutations and been quite stable for a virus. Its genetic code consists of 30,000 ‘letters’ and two other mutations had already been identified: one in Spain and one in Danish mink. The Covid-19 Genomics UK (COG-UK) consortium was set up in April 2020 to genetically sequence random positive samples of COVID-19. Since inception, the consortium has sequenced 140 000 virus genomes from people infected with COVID-19. 

It was this consortium which picked up a variant of SARS-CoV-2 with 23 mutations, 17 of which may affect its behaviour. One of these mutations causes changes to the spike protein on the virus. As the spike protein is used by the virus to infect cells it is possible that this mutation could make the virus more infectious. This ‘variant under investigation’ has been called VUI-202012/01 or B.1.1.7.

The variant was identified in September and as of 15th December accounted for 20% of viruses sequenced in Norfolk, 10% in Essex, and 3% in Suffolk was likely to have arisen in the UK. It accounted for 62% of new infections in London in the week ending December 9th, up from 28% in early November.

Based on computer modelling it’s been suggested that this new variant is 70% more transmissible than non-variant COVID. The R number, the average number of people every person infected can spread the disease to, seems to be 0.4 higher for the new variant.

Fortunately, one mutation in the spike protein is not likely to render the virus resistant to antibodies generated by the virus so far. However, if sufficient changes to the spike protein were to happen then, yes, the vaccine may be ineffective. This is why we need a different influenza vaccine each year as the influenza virus mutates so quickly.

There is some good news though. Thanks to platform technology we now have a way of quickly producing new vaccines. We have the basics sorted; we would just need to change the mRNA used in the Pfizer and Moderna vaccines or the spike protein expressed in the Oxford vaccine.  

Of course, as viruses mutate as they replicate if we reduce cases in the community through vaccination and social distancing we will, as a consequence, reduce the mutation rate.

I’ve seen memes about thalidomide comparing it to these vaccines, how do we know they’re safe?

Just as with any medicine, no vaccine is perfect although as shown above the risks are far outnumbered by those of disease. Thalidomide is not a vaccine, it was marketed in 1957 for morning sickness and discontinued in 1961 due to birth defects. The problem was with the thalidomide molecule and its orientation. The ‘left-handed’ thalidomide was safe, the ‘right-handed’ caused birth defects. This is why it is important to monitor the safety of all medicines.

Medical legislation in this country is incredibly robust; there are 349 individual regulations in 17 parts to make sure any medication, healthcare equipment or vaccine is safe. This includes the reporting of any ill effects. The emergency authorisation is being constantly reviewed and will be rescinded if the vaccine is found to be unsafe.

All of the vaccine trials have been clear when it comes to reporting the rates of adverse reactions to their vaccines. Oxford-AstraZeneca, Moderna and Pfizer/BioNTech have all reported low rates of adverse reactions. The Oxford-AstraZeneca trial was paused due to three adverse reactions: one was in a patient who had not received the COVID-19 vaccine, one had a high fever and it wasn’t known which vaccine they’d received as they were still blinded at that point. One participant who received the COVID-19 vaccine had an inflammation of the spinal cord 14 days after their booster which settled.

The most common ones included pain at the injection site, muscle pains, headache and feeling generally unwell. This is in keeping with any vaccination as those symptoms as a sign of it generating the immune response we want. Last year when I had my influenza vaccine my arm was sore and swelled up at the injection site. This year I felt run down the day after. Both times I took Paracetamol and had a nap. The next day I was fine. Both times were better than having influenza. Having seen the look on patients’ faces struggling to breathe thanks to COVID-19 as they are taken away to be intubated and ventilated I can assure you that the mild side effects of a vaccine are better.

Did we approve this vaccine faster due to Brexit?

In short, no. The UK approved the vaccine before the EU using regulation 174 of the UK’s Human Medicines Regulations, which enables the temporary authorisation of medicine prior to approval by the European Medicines Agency in the case of urgent public need. This Human Medicines Regulations came into effect in 2012, 4 years before the Brexit vote. On top of this EU law allows member states to “temporarily authorise the distribution of an unauthorised medicinal product in response to the suspected or confirmed spread of pathogenic agents, toxins, chemical agents or nuclear radiation any of which could cause harm”. It has nothing to do with Brexit.

I heard this vaccine can’t be stored in most places as it needs to be really cold, is this true?

For long-term storage (about six months) the vaccine has to be kept at -70° C, which requires specialist cooling equipment. But Pfizer has invented a distribution container to keep the vaccine at that temperature for 10 days if unopened. These containers can also be used for temporary storage in a vaccination facility for up to 30 days as long as they are replenished with dry ice every five days. Once thawed, the vaccine can be stored in a regular fridge at 2°C to 8°C for up to five days.

Isn’t natural immunity better? 

As far as our bodies are concerned there is no such thing as ‘natural’ immunity. You either develop antibodies through infection or through vaccination. Your body’s response is the same. With infection, you can be seriously unwell as your body’s adaptive immunity kicks in. With vaccination, you develop antibodies without the risks of infection. For example, 0.0001% of patients will experience an adverse reaction to the measles vaccine as opposed to the 0.2% of patients infected with measles who die. The maths is clear.

Don’t vaccines cause autism?

No. The paper which claimed it did was nonsense. 

On 28th February 1998, an article was published in The Lancet which claimed that the Measles, Mumps and Rubella (MMR) vaccine was linked to the development of development and digestive problems in children. Its lead author was Dr Andrew Wakefield, a gastroenterologist. The paper saw national panic about the safety of vaccination. Prime Minister Tony Blair refused to answer whether his newborn son Leo had been vaccinated.

However, Andrew Wakefield held a lot back from the public and his fellow authors. He was funded by a legal firm seeking to prosecute the companies who produce vaccines. This firm led him to the parents who formed the basis of his ‘research’. The link between children developing developmental and digestive problems was made by the parents of twelve children recalling that their child first showed their symptoms following the MMR vaccine. Their testimony and recall alone were enough for Wakefield to form a link between vaccination and autism. From a research sense, his findings were formed by linking two events that the parents thought happened at the same time. But the damage was done. The paper was retracted in 2010. Andrew Wakefield was struck off as were some of his co-authors who did not practice due diligence. Sadly, this has only helped Wakefield’s ‘legend’ as he tours America spreading his message tapping into the general ‘anti-truth’ populist movement. Tragically unsurprisingly, often in his wake comes measles.

Last year the largest study to date investigating the links between MMR and autism was published. 657,461 children in Denmark were followed up over several years (compare that to Wakefield’s research where he interviewed the parents of 12 children). No link between the vaccine and autism was shown. In fact, no large high-level research has ever backed up Wakefield’s claim. For a more explicit takedown of common anti-vaccine myths click here.

If we can develop a vaccine for COVID-19 so quickly how come we can’t develop one for HIV?

The human immunodeficiency virus (HIV) is very different from the SARS-CoV-2 virus. HIV infects and destroys helper T cells and so leaves a patient unable to mount adaptive immunity. This means they are vulnerable to opportunistic infections: this is Acquired Immune Deficiency Syndrome (AIDS). Although the virus was discovered in 1984 we are still yet to develop a vaccine. This is because although people infected with HIV do form antibodies (this is how we detect infection) those antibodies are not actually able to kill off the virus. HIV has the ability to hide from our immune system by producing a protein which stops cells it infects from being detected and destroyed. HIV is also able to impair the function of killer T cells. So, even if a vaccine were available which produced antibodies it is unlikely to be able to completely prevent infection.

A much greater success story has been anti-HIV medication which is able to grind HIV replication to a halt, although not completely kill it. Successful antiretroviral treatment can make a patient ‘undetectable’ — it is impossible to detect their HIV in a blood test. This means it is impossible for that patient to pass on their HIV to others. The availability of antiretroviral medication to be given to people at risk of HIV exposure (Pre-exposure Prophylaxis or PrEP) or to people within 72 hours of exposure (Post-exposure Prophylaxis or PEP) can greatly reduce infection rates. Both are nearly 100% effective if taken properly. We’ve been able to turn an infection with a nearly 100% mortality to a manageable, chronic disease in less than four decades. A future without HIV/AIDS is possible but probably won’t involve a vaccine.

I heard these vaccines use nanotechnology to control us

Nanotechnology springs to mind visions of tiny robots swimming in our bloodstream like something from science fiction. Although nanotechnology is real, it doesn’t mean that. ‘Nano’ means ‘one billionth’ or 1 x 10⁻⁹. So a nanometre is 0.000000001 metres, a nanosecond is 0.000000001 seconds and so on. Nanotechnology basically means technology which creates, uses or manipulates tiny things on the molecular or atomic level. Nanotechnology in Medicine is also called nanomedicine. As these vaccines involve the use of matter nanometres across such as viruses, mRNA and the participles used to wrap around them they are classed as nanotechnology even though not a single tiny robot is involved. 

I heard GPs are being paid to give this vaccine to us

General Practitioners in England are not employed by the NHS. Surgeries are private businesses owned by their partners which the NHS pays to provide services in line with a number of contracts. For providing some services, such as vaccination, the GP surgery charges an ‘item of service’ to the NHS. This fee covers the cost associated with providing the vaccination and is paid by the NHS to practices. It is used to pay for costs associated with providing the treatment.

In a letter sent to GPs on 9 November, NHS England said that it had agreed with the British Medical Association that the “Item of Service fee” for a potential Covid vaccine would be £12.58 per dose (and so £25.16 for a two-dose vaccine such as the one produced by Pfizer and BioNTech). The letter also confirms that the fee for the flu jab will remain £10.06.

So, yes, they are being paid. But it’s not ‘hush money’ or ‘dirty money’ it’s a contracted amount of money for providing a service.

I heard there is aborted fetal tissue in the vaccines

Sigh. This is where a glimmer of fact has been manipulated.

As discussed above the Oxford vaccine uses a chimpanzee virus. In order to propagate the virus, this required what all viruses need to multiply: cells to invade. This meant the study needed cells to use to grow the virus. This is not unique to research involving viruses, a lot of research requires cells. This is when cell lines are used.

Cell lines are mass-produced by taking original tissue and maintained to keep a reliable supply to use in research. Not every cell line lasts. Cells naturally have a ‘senescence’ or ageing process and so will die off. Cell lines are ‘immortalised’ either because they come from tumour cells which through mutation overcome senescence (this is how cancer starts) or because they are altered after being sampled. Each cell line has its own name.

The cell line used to ‘grow’ the chimpanzee virus for the Oxford virus is called HEK293. It is true the original cells for this line came from the kidney of a female fetus which was either lost to miscarriage or medically aborted in the Netherlands in 1973. Researchers used a virus to make the cells immortal and cultured just one bunch of cells. From this bunch of cells came a cell line. This cell line has been maintained ever since as HEK293, as clones of clones of clones of clones of clones etc. over 47 years. The immortalisation process means these cells are not the same as the original sample and the passage of time means those original cells have long gone. The HEK293 cell line was used to ‘farm’ the chimpanzee virus which is then filtered out of the culture. There is no aborted fetal tissue in this vaccine.

It is fair to say that science has a far from innocent record in this area. The first immortalised cell line, HeLa, was taken without consent from an African-American woman called Henrietta Lacks from the cervical cancer which killed her in 1951. As they were tumour cells, they were already immortal and so were cultured to produce a cell line. The HeLa cell line continues to be used in medical research in areas such as cancer treatment and the invention of the polio vaccine. This is the legacy of ‘the immortal Henrietta Lacks’ whose cells continue to live nearly 70 years after she died. However, no consent was sought or compensation given. Her family were not informed of the cell line until 1975. The case of Henrietta Lacks is an example of the need for informed consent in scientific research. It’s also important that scientists follow ethical procedure because, as we’ve seen from Mr (not Dr) Wakefield, they can do a lot of harm.

I heard the vaccines will make you infertile

This just makes me want to…

media.tenor.com-images-54d526fd183bb842780b9df05ebf6af6-tenor.gif

Right, sorry about that.

OK, let’s take a moment to discuss evidence and science. Let’s say we went up to an astronomer and asked them if the Earth was going to be hit by a comet tomorrow:

Us: “Hi astronomer’.

Astronomer: “Hello (insert name)”

Us: “Is a comet going to hit the Earth tomorrow and wipe out all life?”

Astronomer: “There is no evidence of that happening”.

Us: “What do you mean?”.

Astronomer: “Well, we haven’t picked up a comet on a trajectory with the planet Earth which is big enough to wipe out all life on Earth”.

Us: “So it won’t happen?”.

Astronomer: “There is no evidence a comet is going to hit Earth tomorrow and wipe out all life on Earth”.

Us: “I want definite answers. You’re a scientist, come on, is a comet going to hit us?”

Astronomer: “There is no evidence that will happen”.

Us: “So it could happen?”

Astronomer: “There is no evidence it could”.

Us: “But you’re not certain?”

Astronomer: “I’m a scientist, I look for evidence. We have not found a comet due to hit the Earth so at the moment there is no evidence a comet will hit us tomorrow and wipe us all out”.

Us: “So you’re telling me a comet is going to hit Earth?”

Astronomer: “No, I’m telling you there is no evidence”

Us: “I knew it, we’re all going to die. This is as bad as you guys faking the moon landings”.

Astronomer: “Please leave”.

Scientific proof is not what we think it is. Scientists have ideas or theories and test them. This involves experiments or observation through studies. The results are called evidence. There are levels of evidence which correspond to how ‘good’ a study is based on how it was conducted and how the findings can be applied to other settings. This is fairly obvious: a study conducted in one hospital is not as good as a study involving multiple hospitals across different countries.

Scientists can look at the most recent high-level evidence and draw conclusions based on what best explains what they’ve observed. That is scientific ‘proof’. The theory of evolution best explains the evidence gleaned from fossils, genetic inheritance and DNA. The Big Bang theory best explains the evidence from studying the evolution of stars, galaxies and heavy elements and cosmic microwave background. Observing falling objects and planetary motion is best explained by the theory of gravity. And so on. If observed evidence changes then the theory must change or be rejected for a new one. This is how scientists went from believing the Sun went around the Earth based on the evidence of seeing the Sun move across the sky to believe it’s the other way round. As the famous economist John Maynard Keynes put it so brilliantly:

“When the facts change, I change my mind. What do you do, sir?”

It is the same in Medicine. We’ve seen in patients who take Paracetamol that none of them turns purple with yellow spots. We’ve seen patients who take too much Paracetamol develop liver failure. Therefore, there is currently no evidence that taking Paracetamol makes you turn purple with yellow spots but there is evidence that taking too much Paracetamol causes liver failure.

Somewhere along the line as a society, we have started to demand certainty. We also seem to have somehow reached a point where scientific evidence and personal opinion are now one and the same and can be used interchangeably by members of the public and politicians alike. Scientific evidence is not certain. Nor is it an opinion. It is something which follows a constant process of testing, observing, recording and analysis.

And so back to the question. There is no evidence that the vaccines cause infertility. That’s it.

The building blocks of proteins are called amino acids, and it’s sequences of those that make up different proteins. A small part of the COVID-19 spike protein resembles a part of another protein vital for the formation of the placenta, called syncytin-1. But the sequence of amino acids that are similar in syncytin-1 and the SARS-CoV-2 spike protein is quite short and not the whole protein. They are not the same.

Therefore realistically the body’s immune system is not likely to confuse the two, and attack syncytin-1 rather than the spike protein on SARS-CoV-2 and stop a placenta forming.

This claim came from concerns that the COVID-19 spike protein the vaccines make the body produce antibodies against also contain “syncytin-homologous proteins, which are essential for the formation of the placenta in mammals such as humans”. The authors: Dr Mike Yeadon in the UK, who has made a name for himself as a contrarian to the scientific consensus during the pandemic and Dr Wolfgang Wodarg from Germany, who has a history for casting doubt on everything from pandemic definition to vaccine production demanded that it must: 

“be absolutely ruled out that a vaccine against SARS-CoV-2 could trigger an immune reaction against syncytin-1, as otherwise, infertility of indefinite duration could result in vaccinated women”. 

As we’ve just discussed, no one seriously wanting scientific evidence would make such a request for absolute proof. An actual scientist would think about this problem. Infected patients produce antibodies just as vaccinated people do. Is there any evidence that infected women lose their pregnancy?

This study of 225 women in their first trimester found no increase to early pregnancy loss in those infected with COVID-19. This study compared 113 women pregnant in May 2020 to 172 pregnant in May 2019 and found no increase in pregnancy loss. This study looked at 252 pregnant women infected with COVID-19 found no increase in adverse pregnancy outcomes.  

There is no evidence that the vaccine causes infertility or miscarriages. A couple of attention-seeking ‘truth seekers’ have lit a bin fire and left the serious medical profession to put it out. With that in mind, I am fed up with members of my own profession talking far outside of their area of expertise, cynically or otherwise, during the pandemic and helping to fuel mistrust at a time when we should have stood together. But that’s a blog for another day.

I heard that the vaccine companies can’t be sued if things go badly

Wrong. A government consultation document laid out proposals to potentially authorise a vaccine for emergency use. Existing UK law (as informed by EU law) says that if the government decided to do this, manufacturers and healthcare professionals would not take responsibility for most civil liability claims. But, if the vaccine is found to be defective or not meet safety standards then: 

“the immunity does not apply…(and) the UK government believes that sufficiently serious breaches should lead to loss of immunity”

If the vaccines are found to be dangerous or defective you can guarantee that the companies involved will be sued until their pips squeak. 

* * *

There. I hope this has made sense. Thanks to everyone who reached out and asked questions. I appreciate that this will not be enough for the conspiracy theorists who will say everything I’ve put here is a ‘point of view’ as valid as their memes. For the rational majority, I hope it has answered those questions and any lingering doubts. It has been a strange year and it has never been easier to spread lies. Fortunately, it’s never been easier to spread the truth.

 Why trying to ‘live with COVID’ meant another lockdown

So, here we are the end of England’s Lockdown 2. Lockdown, the word of the year, was supposed to be a one-off as we ‘learned to live’ with COVID-19 until the white knight of a vaccine arrived over the nearest hill. Yet the second lockdown was near-inevitable due to the nature of COVID-19 and the attempts in the UK to control it. This is why.

* * *

“So what do you think should be done about COVID-19?”

Chances are you’ve asked, or been asked, this, probably over Zoom, as your region moved up a Tier or as you contemplated a Christmas without being able to see all of your nearest and dearest. Maybe you were worried about your favourite business or wondering what on Earth a substantial meal is. Or perhaps you’re concerned about University students locked in their halls living off food parcels. Then it all seemed for nought as England entered a month-long lockdown.

It doesn’t mean you’re a COVID-19 conspiracist or a mask-debater; you’d have to have your head in the sand to not be confused or worried about the UK’s response to the pandemic. Stay home, protect the NHS, save lives became ‘Eat Out to Help Out’ before it became easier to list the regions not in Tier 3 before Lockdown 2 arrived. 

As U-turns go, the Prime Minister’s has been the screeching, handbrake on kind. Boris Johnson first went against scientific advice and resisted a ‘circuit breaker’ three-week lockdown. Leader of the Opposition Sir Keir Starmer committed his party to pressurise the government to U-turn.

Then other countries, inside and out of the UK acted. The Republic of Ireland, after similar resistance, announced a six-week lockdown. Wales went into a shorter two-week‘ firebreak’. France and Germany announced new lockdown measures. 

Then, Johnson U-turned and announced a month-long lockdown for England from the 5th November. Flanked by Chief Medical Officer, Chris Whitty and Chief Scientific Officer, Sir Patrick Vallance Johnson painted a grim picture on 31st October. Two key slides showed how projected daily deaths exceeded the government’s own reasonable worst-case scenario and how the NHS capacity would be exhausted.

The two slides shown by Chris Whitty which were used to justify a second lockdown, taken from the BBC

Yet the government has its detractors. Some of Johnson’s own MPs have formed a group, the sardonically named COVID Recovery Group, to impose further lockdowns. They allege that the cure of lockdown is “worse than the disease” and advise that we “live with COVID-19” until mass vaccination is a reality. There is talk of a new political party aimed at opposing lockdowns.

The lockdown sceptics have presented their argument. The Great Barrington Declaration, funded by the American Institute for Economic Research, a libertarian think tank, was published on 4th October 2020 and advocates focused protection for those people most at risk of COVID-19 whilst allowing others to live as normal. Included in its list of signatories are ‘Dr Person Fakename’ and ‘Harold Shipman’. It’s been estimated that about half of its supporters on social media are fake bot accounts. Despite this in response, ten days later, came the John Snow Memorandum advocating a continuation, or even extension, of lockdown measures. So, what to believe?

The simple fact is that in one way or another the UK, like the rest of the Western North Hemisphere world, has tried to “live with COVID”. To try and balance ‘business as usual’ with public health measures. New Zealand, on the other hand, went for ‘zero COVID’ or ‘COVID eradication’. This involved a rapid shutdown, closing the borders and a “level 4 lockdown” which meant that people could only interact with people within their home. New Zealand eradicated COVID-19 and, despite some small outbreaks, have achieved a successful economic and public health outcome. This strategy was based on the experiences of Asian countries with the SARS pandemic. The idea was to take COVID-19 cases to zero. In the UK we have tried to suppress COVID-19 to low levels but not tried to eliminate it. We tried to live with it, with a mixture of opening up the economy whilst applying local restrictions. The result was more cases and more restrictions. 

One of the central tenants of Medicine is informed consent: the ability of patients to make decisions regarding their care based on being presented with all available information. This article will try to do just that: present what the information and what ‘living with COVID-19’ means.

The case against lockdown

The first argument against lockdown is economic. The chancellor Rishi Sunak has spoken of his “sacred responsibility” to balance the country’s books. Yet thanks to COVID-19 the UK’s GDP has plummeted to record depths. More on that later. The next arguments come regarding the people most at risk of the disease.

Public Health England broke down the cases of COVID-19 in each age group. For both men and women, the majority of deaths have been in the over 85 age bracket. For women, this age group has also seen the highest excess mortality compared to the 2015–19 average. For men, the highest excess mortality was in those aged 75–84. What is interesting is that in both men aged over 75 and women aged 75–84 the number of deaths due to COVID-19 exceeded the expected mortality. This means that other expected causes of death actually went down.

Breakdown of COVID-19 deaths by age-group in England to week ending 18th September 2020, Source: PHE

This trend is seen across multiple agencies studying the effects of COVID-19. Despite Boris Johnson promising a protective ring around care and nursing homes, the Office of National Statistics (ONS) estimated about 26,500 excess deaths in care homes and 23,500 excess deaths at home in comparison with the 2015–19 average for March to 7th August.

Why should young university students be stuck in halls because of a virus which is a bigger threat to the elderly? Why should we shut down the economy and hit working-age people? We can’t pretend that lockdown is some benign experience. The impacts on mental health, education and other non-COVID healthcare aspects may take years to become fully apparent. 

The NSPCC have reported record calls to its helpline during lockdown. A study from the London School of Hygiene and Tropical Medicine has found an increase in breast, lung, oesophageal and colorectal cancer deaths. The British Heart Foundation have identified 2085 excess deaths in England and Wales due to stroke and heart disease. The National Blood and Transplant Service reported reductions in donor referrals and transplants.

This, sadly, is not an unusual phenomenon seen in the response to a disaster. Following the terrorist attacks of 11th September 2001 it was estimated that there were 1600 extra deaths on American roads due to people avoiding flying. In response to one threat, we can often go willing into the arms of another. Of course, what isn’t apparent is to what extent this ‘collateral damage’ could have been avoided with planning and foresight. We’ll come to that later.


Research from Imperial College London estimates the risk of dying from COVID-19 for someone infected aged between 10 and 20 at 0.006%. For someone aged 40–49 the risk becomes 0.15%. If you’re aged over 80 it’s 9.3%; nearly one in ten. 

Here comes the argument of ‘shielding’ the most vulnerable allowing the young to restart their lives. Others are far blunter: any lockdown only postpones death, it doesn’t prevent them. What’s the point? It’s time to learn to live with COVID-19. To develop herd immunity. To treat coronavirus like influenza; part of the fabric of life. But what does this mean?

We have vaccinations and central heating. Yet influenza and winter still kill a lot of people.

Influenza makes an easy comparison to COVID-19. Donald Trump and his Brazilian counter-part and political soul mate Jair Bolsonaro have both made the comparison in a typically crass fashion. Both diseases affect the upper respiratory tract. Both are spread primarily through droplets of respiratory secretions. Both are of greatest risk in the elderly and those with pre-existing co-morbidities. We don’t shut down for ‘flu so why should we for COVID?

The UK government tracks influenza and each year produces an annual report of that year’s ‘flu season’. They are all free to access here. The data collected tells us that from the winter of 2015/16 to week 9 of 2020 56,461 people died in the UK of influenza.

UK Influenza Deaths, Source: PHE

Influenza is a disease with which we have “learnt to live”. A disease for which we can offer proven vaccinations to those patients most at risk. Yet 56,461 people in the UK have died of influenza in the past 5 years. In the single worst winter, 2017–18, over 20,000 people died. These numbers are likely to be an underestimate given that not every patient with influenza is tested.

England and Wales Excess Winter Deaths, Source: ONS

Something else we have ‘learnt to live with’ is winter itself. Yet winter is associated with an increase in mortality due to factors such as infections and the cold. An increase in mortality for a period of time compared to the historical average is known as excess mortality. The Office of National Statistics (ONS) reports that the winter of 2017/18 saw 49,410 more deaths in England Wales than the five-year average for winter. For the winter of 2018/19, they estimate an extra 23,200 deaths.

Despite modern medicine, heating and knowing full well what winter involves it has killed over 70,000 people more than expected in just two years.

COVID-19 has killed more people in less than a year than influenza has in five

UK Influenza Deaths, Source: PHE compared to UK COVID-19 Deaths, Source: WHO

So, having ‘learnt to live’ with influenza and winter how does COVID-19 compare? At the time of writing the World Health Organisation (WHO) reports that there have been 58,245 deaths in the UK due to COVID-19. This is far greater than the recorded UK deaths due to influenza in any one winter. In fact, it is greater than the total recorded influenza deaths for the past five winters. The WHO figure could be an underestimate. The ONS records COVID-19 deaths if the disease is mentioned on the death certificate not only if there is a confirmed positive result. The ONS estimate that there were 51,935 deaths due to COVID-19 in England and Wales up to 7th August. If correct this is only 4,526 less than the total deaths due to influenza since 2015/16.

England and Wales Excess Winter Deaths compared to England and Wales Excess Deaths March-August 2020, Source: ONS

The ONS estimates excess mortality of 58,000 in England and Wales for early March and 7 August 2020 compared with the 2015–19 average for the same period. This again is far greater than the excess mortality seen for the 2017/18 and 2018/19 winters. Between January and August, 2020 COVID-19 was the underlying cause of death for three times as many patients as influenza and pneumonia in England and Wales.

COVID-19 has a far greater burden on healthcare than influenza

Of course, mortality is just one way to measure the impact of a disease. Another is how poorly is makes patients and the level of care they require. In this regard again COVID-19 has a greater impact. 

Total Influenza ICU Admissions in England and Peak Weekly Admissions for 2018-19, Source: PHE compared to COVID-19 ICU Admissions, Source: Gov.uk

During the 2018–19 influenza season, a total of 2,924 patients in England were admitted to intensive care in England due to the disease. At its peak, 287 patients were admitted in one week to an intensive care unit due to influenza. In comparison at the peak of the first wave of COVID-19 on the 12th April 2020, 2,881 patients in England were in intensive care requiring mechanical ventilation. On 2nd April, ten days after the first lockdown was announced, 1,494 patients were in intensive care in England for mechanical ventilation due to COVID-19. By 1st September this had fallen to 59. By the time Johnson announced a second lockdown, just over eight weeks later, it had risen to 815 patients. It has continued to rise. At the time of writing there are 1,417 patients in England in intensive care for mechanical ventilation due to COVID-19. ‘Living with’ COVID-19 is not the same as ‘living with ‘flu’

Other aspects of COVID-19 also make any attempt to ‘live with it’ very difficult. Asymptomatic patients may unwillingly spread the disease to the vulnerable. It’s also worth pointing out that it is not as if COVID-19 is benign for younger people. The extent of ‘long COVID’ is still becoming apparent. 

Recently work was published looking at results from the COVID Symptom App which gives an idea of the extent to this condition. 88% of Italian patients hospitalised with COVID-19 report symptoms 2 months later. 55% of French patients report fatigue 110 days after being hospitalised with COVID-19. Although younger people are at a reduced risk, cases of multi-organ failure have been seen in children and young people infected with COVID-19. Oxford University performed MRI scans on COVID-19 survivors and found post-infection changes to the lungs and other organs including the brain. We don’t know if in a few decades time long-term consequences may be revealed in younger people infected with COVID-19 today. To this raft of physical symptoms comes news of mental health problems being reported in survivors of COVID-19.

The virus isn’t becoming ‘less deadly’ and herd immunity isn’t happening (without a vaccine)

While SARS-CoV-2 is slowly mutating the implications of this are not clear. There is no evidence that the virus is becoming ‘milder’. The Financial Times global database found that those countries which suffered the most in the spring seem to be becoming hotspots in the autumn again.

Source: Financial Times

The implications of the new ‘mink variant’ remain unclear. If anything, the risk may be greater; the virus mutates to a form untouchable by vaccines in production, rather than becoming ‘milder’. Nor are we becoming immune ‘naturally’.

Herd immunity describes the number of individuals in a population who would need to be immune to a disease (either through vaccination or previous infection) to prevent transmission to vulnerable non-immune people. Each disease has a different proportion needed, 95% in measles, for example. The WHO estimate that about 70% of the population would need to have immunity to COVID-19 to confer herd immunity. There is no evidence we are anywhere close to that target. Even Sweden, held up as an example for lockdown sceptics, has not received that target with one recent study in the Journal of the Royal Society of Medicine finding evidence of immunity in just 15%. Imperial College London has reported that antibody prevalence in England is falling, not rising.

Sweden is an example, but not a good one

Source: The Spectator

A more detailed examination of Sweden’s COVID-19 shows some uncomfortable truths. While they have recorded fewer deaths per million compared to the UK (most countries have) they dwarfed their Nordic neighbours. Once lockdown was first announced in the UK deaths per million actually fell below Sweden’s.

Source: Financial Times

The country’s public health agency has recently admitted that their predictions about a second wave in Sweden were wrong following a surge in cases.

The systems we needed haven’t worked


The story of the Track and Trace programme has not been a happy one. 15,841 positive cases went untraced and had to be retrospectively added to the caseload. Looking at the most recent data on the Track and Trace system tells us that 40.1% of contacts of cases were not being reached. When the ONS launched its COVID-19 survey in May 51% of households signed up. That number has now fallen to 5%. Johnson’s much-vaunted ‘moonshot’ rapid testing trial failed to identify COVID-19 infection in over 50% of cases.

Going into how the government has awarded contracts and positions of responsibilty could be an article in of itself. The bizarre story of Michael Saiger is perhaps the most potent example of how the government has sought to answer the pandemic. Saiger, a Miami- based jewellery designer, earned £200 million in contracts from the UK government before paying £21 million to a Spanish businessman, Gabriel Gonzalez Andersson, to act as a go-between and source PPE. More on the economic response later. 

Shielding would be near impossible


The idea of ‘shielding’ the elderly sounds simple and honourable but in reality, would be deeply impractical. Data from Age UK reveals that a third of households in the UK are headed by someone aged 65 or over, 19% of carers are themselves aged over 65 and one in five people aged 50 to 64 in the UK are a carer. Cutting off the older age group from society would be impossible. This is without mentioning the ethical concerns of sacrificing older people for the sake of the economy, not to mention other issues. Sweden recently lifted restrictions on the over-70s citing the physical and mental consequences of social isolation.

What about at-risk groups? Public Health England’s report, Disparities in the risk and outcomes of COVID-19, makes for sobering reading. People of Chinese, Indian, Pakistani, Other Asian, Black Caribbean and Other Black ethnicity had between 10 and 50% higher risk of death when compared to White British. Should all these people shield? Working-age males diagnosed with COVID-19 were twice as likely to die as females. Should all men shield? It’s a non-starter. 

Economy vs lives is not an argument

Source: Financial Times

Opponents of further lockdowns use the argument of how much economic pain is worth saving lives? It’s a facile argument because the opposite question can easily be posed: how many deaths are worth protecting the economy? This is not a zero-sum game. According to data from the Financial Times economic impact of COVID-19 has been worse the poorer a country has been at controlling the disease. The two go together not as separate strands.

True, the economic impact of COVID-19 has been huge. Some of this has been due to the UK’s poor pandemic preparation. For example, The National Audit Office has revealed the price of sourcing PPE due to an inadequate stockpile. Between February and July this year, the Department of Health and Social Care spent almost £12.5 billion buying PPE that would have cost £2.5 billion before the pandemic.

As the UK’s economy is set shrink by 11.3 per cent in 2020 and the government would need to borrow £394bn to fund a shortfall in taxes and £280bn in public spending the fact is the money hasn’t been well-spent. Compared to other G7 countries the UK is set to spend over 80 per cent more, with a 90 per cent deeper decline in economic output in 2020 and almost 60 per cent more deaths. The reason appears to be delays in both the spring and autumn to impose lockdown with the result being harsher measures undermining the economy.

With the focus on COVID-19 it is easy to forget that in five-or-so weeks time will come the end of the UK’s transition period with the EU and the full impact of Brexit will hit. So easy, that Sunak did not mention it during his spending review statement. Yet for all the pain COVID-19 has wrecked the economy with the London School of Economics and the Office of Budget Responsibility both predict greater harm from the UK leaving its largest trading bloc.

Source: LSE

It is predicted that by the end of 2022 COVID-19 will have resulted in a 1.7% decline in GDP. In other words, the pandemic will cause a nasty, but short impact. However, leaving the EU with a trade deal will cause a 4.9% decline in 15 years time. A no-deal Brexit would cause the economy to shrink by 7.6% in 15 years. One hopes that those MPs pushing against lockdown on economic grounds will be as vigilant in pushing the government to ensure as close a deal as possible to the EU.

What does ‘postponing death’ even mean?

This cuts to the very nature of modern medicine. It is a fact of the human experience that death is ultimately unavoidable. As a doctor should I therefore not stop a patient dying from a heart attack because I’m merely postponing the inevitable? This is a question broader than just COVID-19. The fact is that while life expectancy has improved, the time spent in health has not improved as much. We have added years to life and not life to years.

However, delaying a pandemic is a good thing. It’s not just about saving capacity in a health service it also buys time for research. It buys time to improve care. A meta-analysis and systematic review (the highest level of scientific evidence) of intensive care units in Europe, Asia and America found that mortality amongst their patients with COVID-19 fell by a third from March to May. 

In other words, if the lockdown delayed you contracting COVID-19 by just three months from March to May your chance of survival improved from nearly 40–60 to 60–40. It doesn’t sound like much but it would do if you were the one about to be admitted and wanting to know your chances. It also buys time to trial new initiatives such as mass testing in Liverpool.

Let’s look again at that data from Public Health England which broke deaths from COVID-19 into age groups. 25.4% of deaths due to COVID-19 were recorded in patients aged 0–74. Hardly insignificant. However, life expectancy at birth in the UK in 2017 to 2019 was 79.4 years for males and 83.1 years for females. If we look at deaths in people aged up to 84 we see a different picture: 57.8% of deaths. 

COVID-19 deaths in England in 0-74 age-group compared to 75+, Source: PHE

COVID-19 deaths in England in 0-84 age-group compared to 85+, Source: PHE


In other words, nearly 6 out of every 10 deaths were in people within life expectancy. At what point has someone lived ‘long enough’ and the fact they didn’t reach life expectancy become meaningless? 

The way out


The ultimate step to successfully defeat COVID-19 will be vaccination. Through lockdown and other social distancing measures, the idea is to reduce the number of people infected whilst this key weapon is developed. On Monday 9th November Pfizer and BioNTech announced that initial results for their vaccine: an astonishing 90% efficacy rate. This vaccine was produced in a novel way which could pave the way for faster vaccine production in the future. However, the vaccine currently requires two doses three weeks apart and has to be sorted at about minus 75 degrees Celsius. 

Shortly afterwards Moderna announced the results for their vaccine: 95%. Once again, their vaccine requires two doses but refrigeration at a more manageable, but still extreme, minus 20. Oxford Uni-AstraZeneca then published their data: 62–90% efficacy improved by giving 1.5 doses rather than 2. Their vaccine only needs standard refrigeration at 2 degrees. These announcements are what we have been waiting for.

Source: The Economist

Final approval for vaccines will require time as will planning on how to overcome logistical issues of storage and overcoming vaccine hesitancy. There are also other vaccines in production. This is what the time lockdown gives us can do. There will be people alive to be vaccinated who wouldn’t have been without lockdown.

Lockdown also works. Non-pharmaceutical interventions such as staying at home and closing businesses have proven very effective at limiting the spread of COVID-19. The inverse is also true. Any relaxation means an increase in transmission. Data shows that by cutting long trips in particular lockdown limits transmission. It is a harsh medicine but necessary. All the more bizarre then the government’s Christmas bubble idea. A political decision with little Public Health behind it, it risks a lot. It’s sad that the message with it was that it was the season “to be jolly careful”. Hardly clear.

* * *

Boris Johnson grew up wanting to be ‘world king’. In December 2019 as he won a historic election a few cases of atypical pneumonia in China would have been the last thing on his mind. 2020 wasn’t supposed to be like this. This was supposed to be the year of Brexit finally delivered and of a new levelling up agenda. But this is what leadership is all about. Tony Blair won a second landslide on 7th June 2001 yet his whole premiership would be redefined on September 11th that year. Gordon Brown came to power in 2007 little knowing that the prize he’d lusted after for a decade would be wrecked within a year by the credit crunch. You don’t choose the circumstances. When the inevitable inquiries come into how the UK responded to the COVID-19 pandemic our leaders have to own the decisions they made and explain how and why they came to them. That is leadership.

It might also be wise leadership to explain how the UK went from a leader in pandemic planning in 2008 to the situation we are in now. To explain why we were so poorly prepared for a pandemic that the health service was unable to meet usual demand as well as face COVID-19? It might also be wise to detail the extent the findings of Operation Cygnus, the pandemic planning exercise in 2016, were used to shape policy. What was learnt and what was forgotten?

Finally, in a bid to end on a positive note it is important to look at just what we have achieved this year. When the Black Death hit the British Isles in 1348 it would be another 500 years before the cause was identified and another century before a cure was available. It took 80 years to identify the virus behind ‘Spanish ‘flu’. When HIV/AIDS first appeared in 1981 it was 3 years before the virus behind it was identified and another decade before a reliable treatment was available. In one year we have gone from a new disease to identifying the virus, sequencing its genetic code, finding a reliable treatment for the most severe cases and now have multiple vaccines available. This is astonishing. We should be proud of what we have got right. We should also learn from the things we got wrong. 

Mad, Bad and Dangerous: Answering COVID-19 Conspiracies

The Electromagnetic Spectrum

“A Lie Can Travel Halfway Around the World While the Truth Is Putting On Its Shoes”

Last Saturday saw a protest in London against the COVID-19 lock down. Its architects were global warming denialist Piers Corbyn and David Icke, a man who alleges that the British Royal Family are actually giant lizards. Cue a deep dive into COVID-10 conspiracy theories. No one can agree which conspiracy is the correct one but there definitely is one. Wake up sheeple! 

The above tweet from Joe Politics showing anti-lock down protesters caught my attention as it nicely displays the general themes these lies have taken: the virus isn’t real, it’s being used as an excuse by governments and that 5G is behind the whole thing. I thought I’d go through each of the claims made by the protesters in the video and look to see if the science backs them up. In summary it doesn’t. For more information, read on.

“I believe that the virus is real, but it’s not as bad as they are saying it is”

“The mortality rate for this is less than the ‘flu. It’s been proven”

I’ve grouped these two claims together as they are on a similar theme and echo sentiments made by people in power such as Brazilian President Jair Bolsonaro.  Is COVID-19 as bad as is made out?  

It depends on which ‘flu you mean.  Influenza is a disease which has been with mankind for a long time.  Hippocrates the Ancient Greek physician described what sounds like ‘flu over 2000 years ago.  It is caused by a virus of which there are three kinds: A, B and C.  The most  common is Influenza A.  Influenza A viruses contain two proteins: haemagglutinin and neuraminidase which are abbreviated to ‘H’ and ‘N’.  Strains of influenza A are distinguished by the type of these proteins, or antigen, they express on their outer surface; H1N1 being one strain, H2N2 being another and so on.  

There’s been a lot of talk of the influenza pandemic of 1918-1919; often called ‘Spanish ‘flu’.  This was caused by H1N1 Influenza A.  It’s estimated that it infected 500 million people worldwide, killing 50 million.  That’s a mortality rate of 10%.  

By comparison as of 1st September 2020 there have been 25,694,471 confirmed cases of COVID-19, including 855,962 deaths, reported to the World Health Organisation (WHO). That’s a mortality rate of 3.33%. So he’s right, COVID-19 has a mortality rate about a third of Spanish ‘flu.  

But hang on.  Because we have lived so long with influenza we have entered into an ‘arms race’: the virus mutates, we develop immunity, the virus becomes less deadly until a new mutation and so on.  This is the difference between seasonal ‘flu we experience every year and pandemic ‘flu.  

Since 1919 we have also developed influenza vaccines not to mention we’ve made vast improvements in public health.  The H1N1 virus was also behind the swine ‘flu pandemic of 2009-2010.  Over 80 years since the Spanish ‘flu.  Same virus, 80 years of medical improvements later.  The WHO reported  491,382 confirmed cases and 18,449 deaths.  That’s a mortality rate of 3.75%.  Only slightly more than COVID-19.  

What about a different Influenza A virus?  The Asian ‘flu pandemic (H2N2) of 1957 to 1958 had a mortality rate of 0.3% in the UK.  Much less than the 12.4% mortality we’ve seen with COVID-19 in the UK at the time of writing.  

Data for the 2019-2020 influenza season is still being collected and, understandably, research has been superseded by the COVID-19 pandemic. When saying one disease is ‘worse’ than another it’s important to try and limit differences as much as possible.  Here in the UK we have a much more sophisticated healthcare infrastructure than a lot of the world with some diseases which cause huge numbers of deaths worldwide such as malaria non-existent here.  

To that end let’s look at numbers as focused and comparable as possible.  

On 3rd June 2020 the Scottish Intensive Care Society Audit Group published a report on COVID-19.  Between 1 March 2020 to 16 May 2020 there were 504 patients with confirmed COVID-19 admitted to intensive care units in Scotland.  Of these patients, 38% died.  

Looking at data available from the 2018-2019 influenza season tells us that from October 1st 2018 to April 8th 2019 only 166 patients with influenza were admitted to an intensive care unit in Scotland.  Of these patients, 19% died.  

In other words, in just 12 weeks over three times the number of patients in Scotland were admitted to intensive care with COVID-19 than those admitted over 27 weeks with influenza.   The mortality rate for COVID-19 was double that of influenza.  

Three times the number of patients. Double the mortality rate.  In less than half the amount of time.  

The CDC in the USA has recorded 34,157 deaths due to influenza in the 2018-19 ‘flu season. This represents 10.4 deaths per 100,000 people in the USA.  As of 11th June 2020, the World Health Organisation has recorded 111,978 deaths in people in the US who tested positive for COVID-19.  This represents 32 deaths per 100,000.  

This disease is bad.  It has a lower mortality rate than the worst influenza pandemic ever but that is hardly a comfort.  Spanish ‘flu’s mortality rate is dwarfed by that of the Black Death where it’s estimated a third of the population of Europe died.  Does this make deaths due to Spanish ‘flu inconsequential?  Of course not.  Once again.  This disease is bad.  It’s much worse than seasonal ‘flu and even some pandemic ‘flu.  

“The test that they use, it has an 80% false positive.  This virus has never been proven to exist”

Let’s start with the bit about the virus not existing.  

Viruses are bizarre.  First, there’s what they actually are.  They are just a collection of genetic material wrapped in an envelope of proteins and sugars.  That’s it.  Then there’s their size.   They are tiny.  You could fit 100,000 of even the largest species of viruses on a full stop.  As a result whilst the existence of an infective agent smaller than bacteria was hypothesised in the 19th century it wasn’t until 1931 when we could actually see them.  This was due to the invention of the electron microscope which used beams of electrons rather than light.  Then there’s how they multiply.  By themselves, viruses appear inert.  It is only when they infect a host they are able to multiply.  They injecting their genetic material into the host’s cells which hijacks their normal functioning.  The cell instead starts producing more virus until it ‘explodes’ releasing the new virus which can infect more cells and so on.

The severe acute respiratory syndrome coronavirus 2 (SARS-CoV-2) virus behind COVID-19 is a member of the coronavirus ‘family’ of viruses.  Coronaviruses were first identified in chickens in the 1930s and in humans in the 1960s.  Their name comes from the Latin for crown because when viewed down an electron microscope spiky proteins on their surface looks like the points of a crown.  They are common and have been found in a variety of animals from bats to camels.  It’s estimated that about a quarter of all cases of the common cold are caused by coronaviruses. Their pandemic potential has also been proven.  The Severe Acute Respiratory Syndrome (SARS) pandemic of 2003 (8096 cases, 774 deaths) and Middle Eastern Respiratory Syndrome (MERS) pandemic of 2012 (2494 cases, 858 deaths) were both caused by a coronavirus.  

The first cases of COVID-19 were identified in an unusual pneumonia in China in December 2019.  Within a month SARS-CoV-2 had been genetically sequenced.  In February the first electron microscopy pictures of the virus were released.  We’re tracking its mutation rate.  We have modelled the structure of the virus’s membrane and the receptors in humans it targets and replicated these in mice.

So to clarify: this virus comes from a family we know a lot about and which has already been shown to cause pandemics.  Within a couple of months of becoming aware of it, we have been able to sequence its genetic material and even take photographs of it.  We know how it targets us and we’re tracking its evolution.  It exists. It has been proven to exist. 

What this illustrates is a fact about conspiracy theories and theorists.  Whilst one of the interviewed protesters was happy to admit the virus is real this gentleman claimed it hasn’t been proven to exist.  If there’s a conspiracy what is it?  You see this with claims about JFK, the moon landings or vaccines.  Everyone has their own ideas: it was the mafia, it was the CIA etc.  Surely if there is a conspiracy only one of them can be right?  But which one?  Maybe the reason there are so many conspiracy theories is that they’re all wrong whereas people following an actual scientific method tend to arrive at the same conclusions: Lee Harvey-Oswald killed JFK, the moon landings happened, vaccines are safe and COVID-19 exists.  That’s not a conspiracy.  It’s just the reason why we have a scientific method in the first place.

Now, what about this claim about 80% false positives?

No test is perfect and there are ways of being able to assess any test used in Medicine.  One is the ability of a test to detect disease in someone who has it.  This is sensitivity.  Another is a test’s ability to rule out disease in people who don’t have it.  This is specificity.  

This chap is alleging that the test for COVID-19 has a false positive rate of 80%.  He’s claiming that 80% of positive results for COVID-19 are wrong; that people without COVID-19 are testing as positive.  Therefore he is alleging that the test for COVID-19 is not specific enough; it is failing to rule out the absence of disease in 80% of cases.  Never mind the fact that if the virus didn’t exist the false positive rate would actually be 100%, let’s explore that figure of 80%.  That doesn’t sound right.  That’s because it isn’t. 

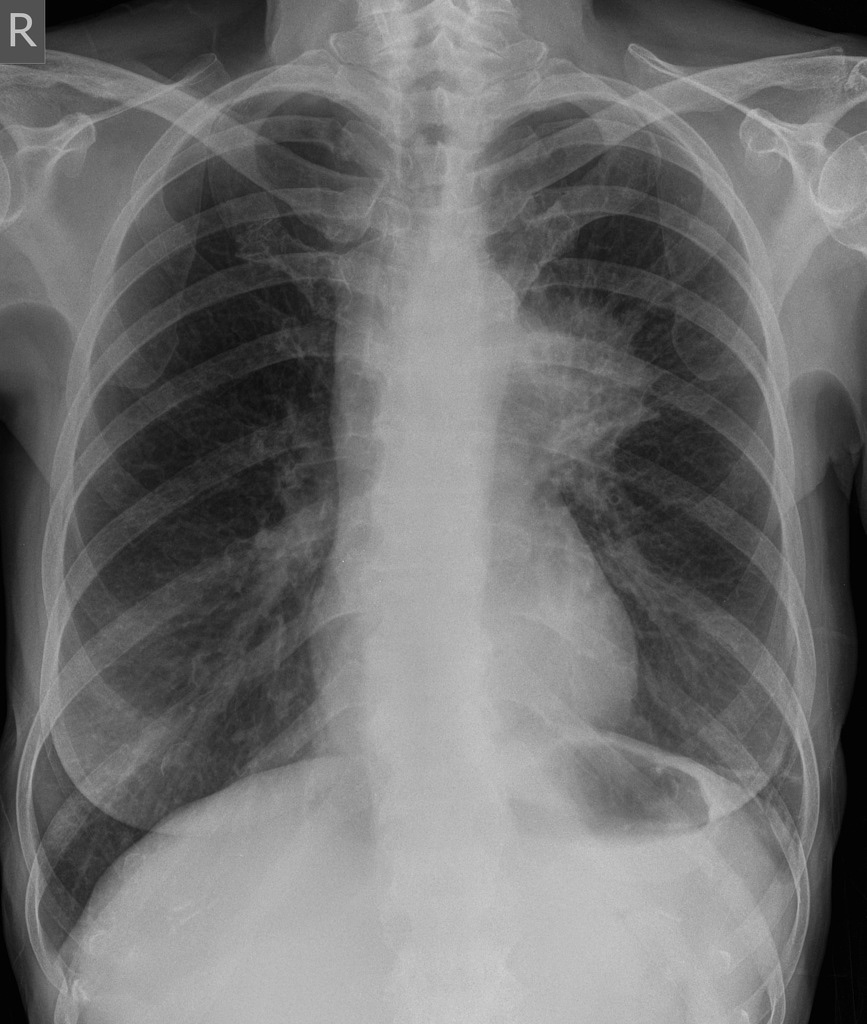
Firstly it’s important to look for a disease in the right place.  The Ebola virus, for example, is spread by direct contact with body fluids.  The blood of a patient with Ebola as well as other fluids such as vomit is therefore full of the virus.  COVID-19, by comparison, is spread by coughing up droplets containing the virus and so it sticks to the respiratory system.   

A study in China looked at different samples taken from patients known to have COVID-19.  In all, they looked at over one thousand samples taken from over two hundred patients.  Only 1% of the blood samples taken showed the virus.  By contrast, the best sample for detecting the virus was bronchoalveolar lavage: a test performed by shooting water in the deep airways of a patient and then collecting it to see what the washing picks up.  93% of these samples found the virus.  But this is a test only performed on sedated patients; it can’t be used in mass testing.  The study also looked at swabs taken from the nose and throat (the tests we use most commonly) and found they detected the virus in 63% and 32% of patients respectively.  This suggested a false negative rate of 37% for nasal swabs and 68% for throat swabs.  According to Dr Jessica Watson; a GP studying the quality of diagnostic tests, who appeared on a recent episode of the BBC Radio 4 show More or Less, the nose and throat swabs being used in the UK currently pick up the virus in about 70% of patients showing symptoms.  

This all indicates that the problem is with false negatives rather than false positives; with sensitivity (finding the disease in people who have it), not specificity (ruling it out in people who don’t).  This makes sense.  The test for the virus looks for its genetic material.  In order to detect it, we run a polymerase chain reaction (PCR) test which takes a small sample of genetic material and makes more of it in order so it can be analysed.  This is the same principle used in forensics.  If a swab is taken too early in the infection or too late there may not be enough virus around to detect.  If the person taking the swab doesn’t use the right technique it won’t pick up enough or any virus to analyse in the first place.  That’s before we even get onto the UK’s policy toward testing and the phenomenon of asymptomatic patients.  

Rather than a false positive rate of 80%, there is, in fact, a false negative rate of about 30%.  Far from over-diagnosis the problem, in fact, is with under-diagnosis.  In both counts this man is wrong.  

“If you look up radiation poisoning, the effects of that and the effects of COVID-19 fit together like a glove”

Ah, the 5G conspiracy.  100 5G masts have been set on fire in the UK due to the belief that the wireless network either created the COVID-19 virus or has weakened our immune system to the point that we’re more susceptible to the virus.  Of course, this is nonsense.  Let’s look at why.

5G is so-called because it is the fifth generation network being used by mobile phones.  The idea being it uses radio waves of a higher frequency (the number of waves in a given period of time) than previously used so a greater amount of information can be transmitted. Waves at a greater frequency can’t travel as far so more towers are needed to transmit.  Radio waves are a form of electromagnetic radiation.  Uh-oh, radiation.  That’s bad, right? Not necessarily. All forms of electromagnetic radiation exist on a spectrum, the electromagnetic spectrum, with waves of shorter frequency on one end and those of higher frequency on the other.  Those waves of a higher frequency are called ‘ionising radiation’; the waves are able to interfere with the structure of atoms.  It is ionising radiation which can damage DNA.  Lower frequency, or non-ionising radiation, can not do this as the waves don’t carry sufficient energy.  You’ll note that even though 5G uses higher frequency radio waves their frequency is still so low they sit comfortably on the non-ionising side of the spectrum.  You’ll also see that as well as nuclear radiation on the ionising side there is also visible light.  This is why sunburn is so serious as light waves have the ability to damage skin and mutate DNA to cause cancer.  But of course, no-one protests against the Sun.  Or light bulbs.

But let’s for one moment break the rules of physics and pretend that 5G is ionising radiation.  Luckily there’s a resource for healthcare workers called Toxbase which gives advice on all things toxicological.  For patients recently exposed to ionising radiation it gives these symptoms:

“Nausea, vomiting, anorexia, mild pyrexia, erythema and diarrhoea developing hours to days following exposure. Earlier onset of clinical features indicates higher absorbed dose. Conjunctivitis may occur if the eyes have been exposed”.

The WHO gives this information on the symptoms of COVID-19:

“The most common symptoms of COVID-19 are fever, dry cough, and tiredness. Other symptoms that are less common and may affect some patients include aches and pains, nasal congestion, headache, conjunctivitis, sore throat, diarrhea, loss of taste or smell or a rash on skin or discoloration of fingers or toes. These symptoms are usually mild and begin gradually. Some people become infected but only have very mild symptoms.”

Hardly fitting like a glove.

Let’s now listen to the laws of physics and look up what non-ionising radiation (what 5G actually is) can do to you:

“Skin burns, which may be more penetrating than burns from a thermal source.

No consistently replicable effects have been found from exposures at levels below those that produce detectable heating, in particular there is no convincing evidence of common symptoms (e.g. headaches), genetic damage or increased likelihood of cells becoming malignant due to acute or chronic radio frequency exposures (PHE)”.

Again not even fitting like a glove (you’ll have to imagine me doing that thing he did with his hands). 

There are only so many symptoms a disease can cause.  Just because different disease processes have similar symptoms it doesn’t mean those diseases are the same.  High blood pressure and brain tumours are two very different things yet both can cause headaches.  The art of Medicine is in exploring a symptom with history and investigations to find the cause.  Not just reading a list online.  

This is not the only myth about 5G.  Another is that 5G weakens our immune system.  Another is that somehow it caused this virus.  Both are biological impossibilities.  The scruples of people peddling these lies can be shown by the peddling of the £339 ‘5GBioShield’ which claimed to provide “protection for your home and family, thanks to the wearable holographic nano-layer catalyser.”  It was found to just be a normal USB stick.  

I can not emphasise this enough: There is no evidence that 5G is bad for you.  It does not cause COVID-19.  

“You don’t lock the world up for a virus that has a mortality rate of less than 1%”

See above.  Its worldwide mortality rate is currently 3.33%. That’s more than 1%.  Not less. 

But anyway, why did we lock the world up?  The reason is not just with the number of people who might die but also the burden placed on healthcare systems.  One way of looking at how infectious a disease is by measuring its basic reproduction number called R nought (R0).

One study in Wuhan, China found that COVID-19 had an R0 of 3.  This means that every patient infected another 3 people and so on. That doesn’t sound much but in just 13 steps:

1 -> 3 -> 9 -> 27 -> 81 -> 243 -> 729 -> 2187 -> 6561 -> 19683 -> 59049 -> 177147 -> 531441 -> 1594323

One case could become more than 1.5 million.  As the disease emerged it became apparent that 5% of patients infected developed critical illness.  That would be 75,000 patients needing critical care.  In the most recent data available before the COVID-19 lock down there were 4,122 intensive care beds in England.  1.5 millions patients, 75,000 of whom needing a critical care bed would easily overwhelm our health service.

This is the reason behind lock down, behind ‘stay home, protect the NHS, save lives’ and flattening the curve.  Through lock down measures in Wuhan the study found that the R0 was reduced from 3 to 0.3  This is the crucial step of beating an infectious disease; reaching the point where each patient is infecting fewer than one other person.  This makes the difference between millions of patients and beating the virus.  In the past week, Professor Neil Ferguson a former senior member of the Scientific Advisory Group for Emergencies (SAGE) has claimed that the UK death toll could have been halved if lock down had been started a week earlier.  A recent systematic review and meta-analysis (the highest level of scientific evidence) of the literature in the Lancet strongly supports the use of physical distancing measures in reducing the risk of infection.

For what it is worth measles does have a mortality rate of less than 1% at 0.2% although the disease carries a risk of serious complications.  Despite its low mortality measles is even more infectious than COVID-19 with an R0 of somewhere between 12 and 18. Last year during an outbreak of measles in New York there was a public health emergency slightly prescient of the lock down declared.   Non-vaccinated children were not allowed in public spaces, legislation allowing vaccine exemption was repealed and some pre-schools were closed.   And that’s for a disease where there is a vaccine. So she is wrong.  Both on the mortality rate of COVID-19 and on the lock down.  

“I think we will be living in a far worse, dystopian version of Nazi Germany”

The Nazis were responsible for the systematic discrimination, persecution and murder of people based on a deranged idea of eugenics.  They sent people to work as slaves and die purely because they didn’t fit the perceived Nazi ideal.  They sought out the most vulnerable: the disabled and the young and made them their own plaything to experiment on.  They murdered six million Jewish men, women and children.  I am genuinely staggered how anyone could think a “far worse, dystopian” version of this possible much less make a casual prediction that a lock down designed to prevent a virus is going to bring it about.  I can’t really say anything else whilst being polite.  

So there we have it.  Five conspiracy theories which don’t stand up to scientific scrutiny. I don’t expect this will change minds of the converted, but maybe, as with vaccination we can ring around ‘outbreaks’ of conspiracy and prevent it being spread further. Misinformation drives public health risks such as vaccine hesitancy.It’s not easy.  I’ve tweeted about the lies of anti-vaxxers and been called everything from a clown to a stooge of big Pharma by people who feel their meme corresponds to a medical degree.  But as US Senator Daniel Patrick Moynihan said, “You are entitled to your opinion. But you are not entitled to your own facts”.  

History rhymes: two Prime Ministers, two pandemics

The United Kingdom is in the throes of a pandemic. A new virus without cure or vaccine kills with frightening speed. The Prime Minister is struck down with fever. His life hangs in the balance. It is September 1918. The Prime Minister is David Lloyd George. History may not repeat but she does love to rhyme.

15th September 1918. David Lloyd George, Prime Minister and leader of the wartime coalition government, although not the leader of his party the Liberals, visits Manchester to receive the freedom of the city. It is the last few months of the bloodiest conflict known to man. By the end of the month the German High Command would telegram the Kaiser that victory was impossible. Peace would soon be in sight. However, far more people worldwide would lose their lives to a different, invisible enemy.

Lloyd George receiving the Freedom of Manchester Photo: Illustrated London News [London, England] 15 September 191721 September 1918

H1N1 influenza may well have been circulating in military camps for a while before 1918; the confines and poor hygiene were perfect for viruses to spread and mutate. There is much debate as to where the virus first appeared but given wartime censorship it was credited neutral Spain whose open reporting gave it the impression of being the disease’s epicentre. It would go to infect a third of the world’s population, killing at least 50 million people; more than double the deaths in World War One.

Unusually for ‘flu the victims were not children or the elderly but young to middle-aged adults. There’s a number of theories for this; whether their stronger immune systems actually turned against them and made the disease worse or if those old enough to have lived through the 1889–1890 ‘Russian ‘flu’ pandemic had retained some form of immunity. Whatever the reason those who succumbed rapidly developed pneumonia. As their lungs failed to supply their face and extremities with oxygen they would go blue with hypoxia. This harbinger of death was given the name ‘heliotropic cyanosis’ after the flower whose colour patients were said to resemble.

A plate from Clinical Features of the Influenza Epidemic of 1918–19 by Herbert French

And so to Albert Square, Manchester. David Lloyd George receives the keys to the city. The weather is appalling. Pouring with rain, the Prime Minister is soaked during the lengthy ceremony. He is met by dignitaries and well-wishers, shaking hands and exchanging pleasantries. By the end of the day he is hit by ‘a chill’. Although underplayed this chill renders him unable to leave Manchester Town Hall. A hospital bed is installed for Lloyd George. His personal physician visits him daily. It is eleven days before the Prime Minister is well enough to leave his bed wearing a respirator to both protect his stricken lungs and to prevent infection of others.

Manchester itself was to be an innovator in its response to the ‘flu pandemic. At the time there was no centralised Ministry of Health and so Public Health was a matter for local authorities under the auspices of Medical Officers. The Medical Officer for Manchester since 1894 was James Niven, a Scottish physician and statistician. With total war still ongoing Sir Arthur Newsholme, a senior health advisor to the British government, advised that even with ‘flu spreading munitions factories had to remain open and troop movements could not be interrupted. It was up to Medical Officers to think autonomously. Niven looked back at the pandemic of 1889–90 and noted that unlike seasonal ‘flu which strikes annually, pandemic ‘flu came in waves with each wave often more virulent than before. He argues:

“public health authorities should press for further precautions in the presence of a severe outbreak”

James Niven, Creative Commons

After the first cases of influenza were seen in Manchester in spring 1918 Niven therefore worked to prepare the city for the next wave that he predicted would hit later that year. Manchester was a densely packed working class city, a perfect breeding ground for disease. He closed schools and public areas such as cinemas. Areas which couldn’t be closed were disinfected. He studied statistics to be published on posters throughout the city to give people as much information as possible. He became a regular columnist in the Manchester Guardian advising readers on the symptoms of the disease. He advised that anyone showing symptoms must,

“on no account join assemblages of people for at least 10 days after the beginning of the attack, and in severe cases they should remain away from work for at least three weeks”

Manchester’s ‘flu outbreak would peak on 30th November 1918. Niven reflected that it might have occurred sooner without Armistice celebrations where he was powerless to prevent people congregating on the streets. Niven would remain in post until 1922. As well as his work fighting influenza he also led slum clearance, sanitation installation and improving air quality. Despite Manchester’s population increasing from 517,000 to 770,000 during his tenure the death rate per 1,000 population fell from 24.26 to 13.82. Despite his success in retirement he would be struck by depression. In 1925 he took poison and drowned himself in the sea off the Isle of Man.

Lloyd George would make a full recovery from his illness. He led the country’s Armistice celebrations and remained as Prime Minister until 1922 through the support of his Conservative coalition partners. His struggles for the leadership of the Liberals with his long time rival Herbert Asquith would dominate the party for at least the next decade and see them fall from government to third place in British politics. They would never return. Lloyd George remains the last Liberal Prime Minister in the United Kingdom. He would live to see his hard fought peace shatter and very nearly saw it return again, dying in March 1945.

History doesn’t repeat but she does rhyme. It is human nature to look for patterns and reason comparing the present to what has gone before. For Lloyd George stricken with influenza see Boris Johnson admitted to intensive care with COVID-19. For James Niven see Chris Whitty. However, our knowledge of disease, access to sanitation and healthcare progression is without equal in history. The H1N1 influenza virus behind the pandemic of 1918–19 would not be genetically sequenced until 1999. When COVID-19 first emerged in late December 2019 its genetic sequence was identified within a month. Intensive care and ventilation weren’t even figments of the imagination for the patient in 1918, Prime Minister or not. However, until a cure or vaccine for COVID-19 are realised our best weapon against it remains the advice of James Niven from over a century ago. From a time before social media or hashtags. Stay home.

Super Spreaders: The Story of 'Typhoid Mary'

A new virus which first appeared in a food market in China has crossed the world in a couple of months and declared a pandemic by the World Health Organisation As of 11th March there have been 118 619 confirmed cases of this virus, called COVID-19, worldwide, with 456 in the United Kingdom. Six people in the UK have died. Of those cases in the UK four were all linked to one other infected person who also infected another six, five in France and one in Spain. This is the story of a modern super-spreader and his Victorian era counterpart, ‘Typhoid’ Mary Mallon.

Steve Walsh Pic: Servomex

The case of our modern super-spreader Steve Walsh has been well covered in the media since he reported himself to health authorities. The 53 year old works for the gas analysis company Servomex. From 20th to 22nd January 2020 he attended a work conference in Singapore, one of 94 delegates travelling from overseas to the 109 strong body. One attendee was from Wuhan, China the centre of the epidemic. During the conference Walsh was exposed to COVID-19. Following the conference he joined his family for a holiday at Les Contamines-Montjoie near Mont Blanc in the French Alps from 24th to 28th January, staying in a ski chalet. Still feeling well he travelled on a busy easyJet flight from Geneva to Gatwick and went to a local pub, The Grenadier in Hove, on the 1st February. It was only after conference organisers alerted attendees that one of their number had tested positive for COVID-19 that Walsh alerted the authorities and was himself tested. By this time five Britons who had stayed in the same chalet became ill in France, another Brit returned to their house in Mallorca and fell ill and another group of four people flew home to the UK from the same ski resort and became unwell. All tested positive for COVID-19. All had had contact with Walsh. In the two week incubation period and without feeling unwell Walsh had inadvertently infected 10 people. After a mild illness in quarantine at the specialist infectious diseases unit at Guy’s and St Thomas’ NHS Foundation Trust in London he was discharged on 12th February.

A super-spreader is an individual who is more likely to spread a disease compared to other people with the same infection. The principle which is often used is the ‘20-80’ rule; 20% of people are behind 80% of transmissions. There are many different reasons why one person may be more contagious than others: vaccination rates, the environment, co-infections (men infected with HIV are more contagious if they also are infected with syphilis compared to those infected with HIV alone) and their viral load. A super-spreader may also be a carrier, completely symptom free, who yet can pass a disease onto others. Perhaps the most famous example of this kind of super-spreader was ‘Typhoid’ Mary Mallon.

Mary Mallon was born on September 23, 1869 in Cookstown, County Tyrone in what is now Northern Ireland. By 1884 she had moved to America to live with her aunt and uncle and to seek work as a cook for wealthy families. Between 1900 and 1907 she worked for seven families in the New York City area.

Mary Mallon in quarantine Creative Commons

A strange pattern emerged. Wherever Mary worked there was an outbreak of typhoid fever. This disease is caused by a type of Salmonella bacterium called Samonella typhi and spread in contaminated food and drink. Infected patients develop fever, abdominal and joint pains and vomiting and diarrhea. Some patients develop a rash.

This was very unusual. Typhoid fever was traditionally seen in slum areas and the poverty stricken, not the affluent houses Mary worked at. In 1900, she moved to work in  Mamaroneck, New York. Within a fortnight of her arrival residents fell ill with typhoid fever. The same thing happened in 1901 when she moved to Manhattan. The laundress at the house she worked at died of the disease. She then was employed by a lawyer and again left after seven of the eight people in the house fell ill.

In 1906 she moved to the very well to do area of Oyster Bay in Long Island. At the first house she worked at ten out of the eleven family members living there were hospitalised with typhoid fever. The same thing happened at another three households. Mary continued to change jobs after each outbreak.

She was eventually employed by a wealthy banker, Charles Henry Warren, as a cook. In 1906 when the family summered in Oyster Bay Mary joined them. From August 27 to September 3, six of the 11 people in the family came down with typhoid fever. George Thompson, the man whose house they had holidayed in, was concerned that the water supply might be contaminated and cause further outbreaks. He secured the services of a sanitation engineer George Soper who had investigated similar cases.

Soper published the findings of his research in the Journal of the American Medical Association on June 15th, 1907:

“It was found that the family changed cooks on August 4. This was about three weeks before the typhoid epidemic broke out. The new cook, Mallon, remained in the family only a short time and left about three weeks after the outbreak occurred. Mallon was described as an Irish woman about 40 years of age, tall, heavy, single. She seemed to be in perfect health.”

Soper could link 22 cases and one death to this Irish cook who seemed to vanish after each outbreak. So began a chase similar to that in the movie ‘Catch Me if you Can’; as Soper tried to track down Mary Mallon. When he eventually found her and asked for samples of her faeces and urine she violently refused:

“She seized a carving fork and advanced in my direction. I passed rapidly down the long narrow hall, through the tall iron gate, and so to the sidewalk. I felt rather lucky to escape.”

On another encounter in a hospital where Mary was being treated she locked herself in a toilet and refused to open the door until Soper left. She refused to accept she was the cause of the outbreaks and that she couldn’t work as a cook.

Soper passed the case over to physician Sara Josephine Baker with whom Mary still refused to engage. In the end Baker had to enlist the help of the New York police who arrested Mary. Stool samples confirmed the presence of Salmonella typhi. In 1908 the Journal of the American Association had dubbed Mallon ‘Typhoid Mary’.

Mary was held in isolation for three years of quarantine. By 1910 she was was released having signed an affidavit that she would no longer work as a cook and take all precautions to prevent infecting others. She began to find work as a laundress a position with less job security and lower income. Having struggled to make ends meet she changed her name to Mary Brown and began to work as a cook again. Typhoid once again followed her.

In 1915 she caused an outbreak at Sloane Hospital for Women in New York City infecting 25 of whom 3 died. As before she left her position following the outbreak but authorities found her visiting a friend and arrested her again. This time there would be no second chance and Mary Mallon spent the rest of her life in quarantine. She worked at the hospital she was confined to cleaning bottles in the laboratory. In 1932 she was paralysed by a stroke. She died of pneumonia on November 11, 1938 aged 69.

At post mortem Salmonella typhia bacteria were found in her gallbladder. She had remained a carrier until her death. We now know that 1 in 20 patients with typhoid fever who are not treated will become carriers. They themselves feel well even though the bacteria lives in their faeces and urine and can be spread by poorly washed hands. This is probably what happened to Mary Mallon.

Thanks to her aliases and avoiding authorities Mary Mallon may well have caused up to 50 deaths due to typhoid fever.

Mary Mallon and Steve Walsh both show the impact one part of the infection chain can have. However, that’s as far as the similarities go. Mary knew she was contagious and yet continued to work and put people at risk and did all she could to avoid detection. Yes it’s easy for me to criticise a woman who lived a century ago without job security who feared losing her livelihood. Whatever her reasons as a result of her actions people died. Walsh didn’t know he was infected and made himself known to and co-operated with the authorities as soon as he thought he might be. They both illustrate the same key importance of the public health approach; of contact tracing and identifying sources to break the chain of infection. They also show the value of an individual’s attitude. If we think we might be at risk of passing an infectious disease on we all have to make the choice. Are we going to be like Mary Mallon or Steve Walsh?

Thanks for reading

- Jamie

#FOAMPUBMED 6: Type II Error

nothing-1394845_960_720.jpg

In a previous blog we looked at how Type I error means we wrongly reject our null hypothesis

TYPE II ERROR COMES ABOUT WHEN WE WRONGLY ACCEPT OUR NULL HYPOTHESIS. 

Say you’re developed a new drug. You give it to one patient and they don’t get better. One of two conclusions can be made at this point. Either the drug genuinely doesn’t work and so this is true negative. Or the drug does work but unfortunately not in this patient’s case and so this would be a false negative.

Type II Error is about too many false negatives in our results and not finding a relationship when there is one. This will mean that we will find our new drug isn’t better than the standard treatment (or placebo) when it actually is.

TYPE II ERROR IS ALSO CALLED BETA

In the above example you can see with one patient you can’t tell the difference between a true negative and a false positive.

This means we need to design our study with enough patients to ensure we can tell true and false negatives apart.

This brings us on to the next blog and Power…

Has austerity really killed 120,000 people?

There’s a statistic being widely reported across social and traditional media that the policy of austerity pursued by the UK government since 2010 has been directly responsible for 120,000 deaths. That is an alarming number and accusation. Could the UK government really have killed 120,000 people due to its economic policy?

I should say at this point that I have no particular political axe to grind here. I’m no fan of the Conservatives but I’m certainly a fan of good science and using statistics properly. Therefore this blog will take a look at whether the claim of 120,000 deaths due to austerity alone is correct.

public.jpeg

First some background. In the 2010 UK General Election the Conservative Party stood on a platform of cutting government spending as a response to the global recession. Following the election their leader David Cameron formed a coalition government with the Liberal Democrats. Cameron became Prime Minister and the Conservative Shadow Chancellor George Osbourne became Chancellor of the Exchequer. Cameron and Osborne then enacted their policy of austerity. The result was a cut in welfare spending of £30 billion. Although spending on the National Health Service was ring fenced against spending cuts the average real terms growth in health spending was 1.1%, much lower than under previous governments. Against this backdrop the claim of 120,000 deaths makes sense. Reduced healthcare spending means reduced healthcare provision. Reduced healthcare provision means more deaths.

Nine years after taking office Cameron and Osbourne still defend austerity. In his recently published memoirs Cameron argues his government should in fact have cut spending more. Osbourne has been dismissive in interviews about the negative impacts of austerity. However, Cameron’s successor as Prime Minister Theresa May claimed she had veered away from austerity and the current Chancellor Sajid Javid has annouced an increase in spending to reverse some of the cuts enacted by Osbourne. Both the Conservatives and Labour are making increased public spending through borrowing a feature of their 2019 election manifestos.

Not surprisingly those on the political left have made much of this figure of 120,000. The left wing journalist Ash Sarkar made a passionate argument on BBC Question Time quoting it. But is it correct?

Screenshot of tweets quoting the 120,000 deaths figure

Screenshot of tweets quoting the 120,000 deaths figure

The figure

Let’s first look at where the figure came from: a BMJ Open article from 2017. In their paper, Effects of health and social care spending constraints on mortality in England: a time trend analysis the authors Watkins et al., looked at death rates between 2011 and 2014 and compared these to the expected trend based on previous death rates.

From Watkins, J., Wulaningsih, W., Da Zhou, C., Marshall, D., Sylianteng, G., Dela Rosa, P., Miguel, V., Raine, R., King, L. and Maruthappu, M. (2017). Effects of health and social care spending constraints on mortality in England: a time trend anal…

From Watkins, J., Wulaningsih, W., Da Zhou, C., Marshall, D., Sylianteng, G., Dela Rosa, P., Miguel, V., Raine, R., King, L. and Maruthappu, M. (2017). Effects of health and social care spending constraints on mortality in England: a time trend analysis. BMJ Open, 7(11), p.e017722.

As this graph from the paper shows the authors performed age standardisation, this adjusted for the fact that the British population is made up of people of different ages, and compared the data of 2010-2014 with the previous trend (the blue line). They found that death rates actually went up (the red line) resulting in 45 368 ‘extra’ deaths in those four years. They used this number and extrapolated based on this new trend and found that between 2009 and 2020 there would be “an estimated 152 141 additional deaths.” The authors didn’t just frame this figure within the context of healthcare spending but with social care as well:

“Real-term adult social care spending decreased by 1.19% annually between 2010 and 2014 after correcting for the effect of inflation, reversing the annual increase of 3.17% between 2001 and 2009. This is despite increasing demand, with the group most likely to require social care—the over 85s—set to rise from 1.6 million in 2015 to 1.8 million in 2020.”

The authors also claimed that an additional £6.3 billion extra per year would need to be spend by the government to reverse these extra deaths. Music to the ears of left wing politicians and activists and all of us working in healthcare. As I said above, it seems a reasonable finding. If the government cuts provision for the elderly and sick you would expect to see more people dying. But is it all true?

What has been going with mortality rates?

Firstly, the data and trend reported by Watson et al., (2017) does match data from the Office of National Statistics who also show that the death rates for both genders since 2011 has been above the trend expected based on previous results. In the previous decade there was an overall downwards trend, albeit with brief rises in death rates in both 2003 and 2008, before austerity.

https://www.ons.gov.uk/peoplepopulationandcommunity/birthsdeathsandmarriages/lifeexpectancies/articles/changingtrendsinmortality/acrossukcomparison1981to2016

https://www.ons.gov.uk/peoplepopulationandcommunity/birthsdeathsandmarriages/lifeexpectancies/articles/changingtrendsinmortality/acrossukcomparison1981to2016

So it does look like there have been more deaths than expected since 2011. That’s not up for debate. But can we say these were definitely due to austerity? The short answer is no. Here’s why.

This study couldn’t prove causality

This was an observation study. This is a type of study where the researchers don’t actually interfere by changing what the subjects are exposed to. It’s obviously not possible to have some subjects living under austerity and another group not and so there was no randomisation or control group. Therefore it is impossible to use this study to draw a direct causation. An observational study is limited to suggesting a relationship but not cause-effect. There’s a commonly used phrase: correlation does not mean causality. Observational studies are therefore not high up on the hierarchy of levels of evidence.

LIFE EXPECTANCY IS IMPROVING BUT NOT AS FAST AS BEFORE

As we’ve already seen mortality rates have gone up. But what about life expectancy? Again we can look at ONS data.

The ONS divides the rate of increase year on year of life expectancy between the period 2004-2010 and 2010-2016. Between 2004 and 2010 the UK saw a rapid increase in the rate at which life expectancy improved. Only Portugal and the Netherlands saw higher increases in males and only Portugal and Poland saw higher increases in females. However, since 2010 the UK has seen the lowest average annual increase in life expectancy in females and only the US has had a lower average annual increase in life expectancy in males. Japan on the other hand have had the opposite trend with much faster improvements in life expectancy in 2010-2016 compared to 2004-2010.

The UK remains close to France and Germany and despite higher healthcare spending the USA lags in life expectancy

LE Males.png

So we know that the UK experienced a rapid rate of improvement in life expectancy in the first decade of the 21st century. Since then life expectancy is still improving but at a slower rate, especially in women. If we look at male life expectancy it has remained comparable to both France (orange) and Germany (grey), two similar countries to the UK (green).

LE Females.png

Female life expectancy in the UK has remained higher than in men and has largely caught up with Germany but lagged behind France even before austerity.

Notice how life expectancy in the UK has consistency been higher than the USA, a country with the highest per capita spending on healthcare. Other things must be going on than just spending. And while women may live longer than men why does life expectancy not improve at the same rate for both sexes?

The last few decades have seen improvements in cardiovascular health for older and male patients but also severe influenza epidemics

In the UK death rates from cardiovascular disease have more than halved since it peaked in the 1970s and 1980s. And that rate of improvement has been most prominent in the older age groups with 50% reduction in deaths due to heart disease in the 55-64 age bracket compared to 20% in men ages 34-44. So we’re getting better at preventing deaths due to cardiovascular illness and the most benefit is being seen in older patients. As well as this was an important piece of public health legislation in the UK: the 2007 ban on smoking in public places. Since then the percentage of people smoking in the UK has dropped from 22% to 15%. These are great improvements but the benefit hasn’t been shared out. It is notable that the improvements in cardiovascular medicine and reduction is smoking have benefited men over women. In 1971 women in the UK lived on average 6.3 years longer than men. By 2018 that had fallen to 3.6 years. The gender divide has closed.

In the past decade we have been seeing average increases in deaths due to influenza in the UK:

From The Guardian

2015 saw (at that point) the biggest year to year jump in deaths since 1968. The biggest jump occurred in patients aged over 75. A large contributing factor was that year’s influenza epidemic where antigen shift reduced the effectiveness of the vaccine which had been given. Influenza and other respiratory conditions were reported in a third of deaths in patients with dementia that year. 2017-2018 saw deaths due to influenza triple from the previous year with Public Health England also attributing that year’s particular severe winter to in the increase in deaths. It’s not all bad though. The 2018-2019 winter saw a new influenza vaccine be offered to the over 65s. Although the actual numbers of vaccinated over 65s varied across the UK the 2018-2019 winter saw little excess mortality due to influenza with the greatest health impact being seen in under 64 age groups. Influenza remains a seasonal, and sometimes difficult to predict, series Public Health challenge.

It’s been a pattern of Medicine that we have been increasing life expectancy

At first improvements were seen in reducing child mortality through vaccinations and better treatments for childhood infections. Then, as shown by the data of cardiovascular disease, we’re getting better at getting adults (especially men) to live longer and reduce the rate of heart disease through better treatment and prevention such as the smoking ban. But this means we then have a population of elderly patients who have lived to develop dementia and be vulnerable to the ‘flu.

Another statistic worth mentioning at this point is healthy life expectancy: how many years a person lives in good health free of disability. Whilst this is increasing it is not doing so at the same rate of life expectancy meaning people are living more years in poor health. And this too is favouring men over women. An English male could expect to live 79.6 years in 2015–17, but his average healthy life expectancy was only 63.4 years – i.e., he would have spent 16.2 of those years (20 per cent) in ‘not good’ health. However, in the same year an English female could expect to live 83.1 years, of which 19.4 years (23 per cent) would have been spent in ‘not good’ health.

https://www.theonion.com/world-death-rate-holding-steady-at-100-percent-1819564171

https://www.theonion.com/world-death-rate-holding-steady-at-100-percent-1819564171

As the satirical Onion put it in one of their articles, “the global death rate remains constant at 100 percent.” People have to die. It’s part of the human experience. So perhaps what we’ve seen since 2010 are some of those deaths we’ve previously been able to prevent but can't now. We’re good at preventing deaths due to heart disease but currently can’t cure dementia. We’ve been pushing deaths back later and later and now we’re seeing them this decade as well as more people (especially women) spending more of their later life in poor health.

So is austerity to blame for 120,000 extra deaths? Yes, during the period of austerity there has been a rise in deaths in the UK. And yes, life expectancy has not been increasing as fast as in the previous decade.

However, we certainly can’t say it’s the sole cause. Firstly, the study linking austerity to those deaths is simply not enough evidence. And much of health improvements in the past few decades has been on increasing the number of adults reaching older age and becoming susceptible to conditions we currently can’t cure such as dementia and frailty. We’ve also seen influenza epidemics which have particularly hit the over 65s. It’s likely that the rise in deaths is a mixture of all of these factors.

But while it is wrong to place sole blame on austerity it is important to talk about healthcare spending and what kind of provision we want in this country. We have an ageing population with increasingly complex needs. That needs paying for one way or another. We may also have to shift how we view modern medicine. Healthcare has been about improving life expectancy, simply adding years to life. A patient not dying and living longer than they would have managed without medical intervention is a success. If we are increasing a patient’s life but they are spending those extra years in poor health there is a philosophical argument: rather than adding years to life should we be looking at adding life to those years left?

Thanks for reading.

- Jamie

Are medical errors really the third most common cause of death?

You can guarantee that during any discussion about human factors in Medicine the statistic that medical errors are the third most common cause of patient death will be thrown up. A figure of 250,000 to 400,000 deaths a year is often quoted in the media. It provokes passionate exhortations to action, of new initiatives to reduce error, for patients to speak up against negligent medical workers.

It’s essential that everyone working in healthcare does their best to reduce error. This blog is not looking to argue that human factors aren’t important. However, that statistic seems rather large. Does evidence really show that medical errors kill nearly half a million people every year? The short answer is no. Here’s why.

It’s safe to say that this statistic has been pervasive amongst people working in human factors and the medico-legal sphere.

It’s safe to say that this statistic has been pervasive amongst people working in human factors and the medico-legal sphere.

Where did the figure come from?

The statistic came from a BMJ article in 2016. The authors Martin Makary and Michael Daniel from John Hopkins University in Baltimore, USA used previous studies to extrapolate an estimate of the number of deaths in the US every year due to medical error. This created the statistic of 250,000 to 400,000 deaths a year. They petitioned the CDC to allow physicians to list ‘medical error’ on death certificates. This figure, if correct, would make medical error the third most common cause of death in the US after heart disease (610,000 deaths a year) and cancer (609, 640 deaths a year.) If correct it would mean that medical error kills ten times the number of Americans that automobile accidents do. Every single year.

Problems with the research

Delving deeper Makary and Daniel didn’t look at the total number of deaths every year in the US, which is 2,813,503. Instead they looked at the number of patients dying in US hospitals every year, which has been reported at 715,000. So if Makary and Daniel are correct with the 250,000 to 400,000 figure that would mean that 35-58% of hospital deaths in the US every year are due to medical error. This seems implausible to put it mildly.

It needs to be said that this was not an original piece of research. As I said earlier this was an analysis and extrapolation of previous studies all with flaws in their design. In doing their research Makary and Daniel used a very broad and vague definition of ‘medical error’:

“Medical error has been defined as an unintended act (either of omission or commission) or one that does not achieve its intended outcome, the failure of a planned action to be completed as intended (an error of execution), the use of a wrong plan to achieve an aim (an error of planning), or a deviation from the process of care that may or may not cause harm to the patient.”

It’s worth highlighting a few points here:

Let’s look at the bit about “does not achieve its intended outcome”. Let’s say a surgery is planned to remove a cancerous bowel tumour. The surgeon may well plan to remove the whole tumour. Let’s say that during the surgery they realise the cancer is too advanced and abort the surgery for palliation. That’s not the intended outcome of the surgery. But is it medical error? If that patient then died of their cancer was their death due to that unintended outcome of surgery? Probably not. Makary and Daniel didn’t make that distinction though. They would have recorded that a medical error took place and the patient died.

There was no distinction as to whether deaths were avoidable or not. They used data designed for insurance billing not for clinical research. They also didn’t look at whether errors “may or may not cause harm to the patient”. Just that they occurred. They also applied value judgements when reporting cases such as this:

“A young woman recovered well after a successful transplant operation. However, she was readmitted for non-specific complaints that were evaluated with extensive tests, some of which were unnecessary, including a pericardiocentesis. She was discharged but came back to the hospital days later with intra-abdominal hemorrhage and cardiopulmonary arrest. An autopsy revealed that the needle inserted during the pericardiocentesis grazed the liver causing a pseudoaneurysm that resulted in subsequent rupture and death. The death certificate listed the cause of death as cardiovascular.”

Notice the phrase “extensive tests, some of which were unnecessary”. Says who? We can’t tell how they made that judgement. It is unfortunate that this patient died. Less than 1% of patients having a pericardiocentesis will die due to injury due to the procedure. However, bleeding is a known complication of pericardiocentesis for which the patient would have been consented. Even the most skilled technician cannot avoid all complications. Therefore it is a stretch to put this death down to medical error.

This great blog by oncologist David Gorksi goes into much more detail about the flaws of Makary and Daniel’s work.

So what is the real figure?

A study published earlier this year (which received much less fanfare it has to be said) explored the impact of error on patient mortality. They studied the impact of all adverse events (medical and otherwise) on mortality rates in the US between 1990 and 2016. They found that the number of deaths in that whole 26 year period due to adverse events was 123,603. That’s 4754 deaths a year. Roughly one hundredth the figure banded around following Makary and Daniel (2016). Based on 2,813,503 total deaths in the US every year that makes adverse events responsible for 0.17% of deaths in the US. Not a third. 0.17%.

Of course, 4754 deaths every year due to adverse events is 4754 too many. One death due to adverse events would be one too many. We have to study and change processes to prevent these avoidable deaths. But we don’t do those patients any favours by propagating false figures.

Thanks for reading.

- Jamie

#FOAMPubMed 5: Significance

newspaper-943004_960_720.jpg

SIGNIFICANCE MEANS SOMETHING DIFFERENT IN RESEARCH THAN IN LAY LANGUAGE

Often in the media we hear the results of a new trial showing a ‘significant’ result. A company may market a new drug or product that ‘significantly lowers your cholesterol’ for example. Or ‘such and such significantly increases your risk’ of something.

The trouble is for most of us that means that the effect must be large. The drug or product will make your cholesterol drop by a lot. That’s what ‘significantly lowering’ means to us.

SIGNIFICANCE IN RESEARCH MEANS YOU’VE REDUCED THE CHANCE OF FALSELY REJECTING YOUR NULL HYPOTHESIS

It means you’ve designed your study and recruited enough subjects to reduce the effect of chance. Usually the more significant we want our results to be the larger our sample size needs to be.

In a previous blog we looked at how Type I Error means falsely rejecting the null hypothesis through too many false positives. We looked at how we show we’ve minimised that chance with a p value. The gold standard is p<0.05 which means there is a less than 5% chance of falsely rejecting the null hypothesis.

p<0.05 MEANS OUR RESULTS ARE SIGNIFICANT

That’s what statistical significant means. It’s fairly arbitrary. In reality there’s very little between a p value of 0.049 and a p value of 0.051. Except the former allows you to use the magic words “my results are significant” and the latter does not.

SIGNIFICANCE DOES NOT DESCRIBE THE SIZE OF THE EFFECT

I could study a new drug for blood pressure and find the average reduction in my volunteers is only 1mmHg. That doesn’t sound a lot. But if the p-value is p<0.05 that is statistically significant. I could therefore describe my drug as statistically significantly reducing blood pressure.

The evidence doesn't lie: The case of the Phantom of Heilbronn and the importance of pre-test probability

anxiety-2878777_960_720.jpg

“Evidence doesn’t lie” - Gil Grissom, CSI

Ten years ago police were on the hunt for an unusual serial killer. There were several factors that made this suspect unique. Firstly; she was female, a rarity amongst serial killers. Secondly; there seemed to be no pattern to her crimes. Her DNA was found at crime scenes in France, Germany and Austria dating back to 1993. On a cup at the scene of the murder of a 62 year old woman. A knife at the house of a murdered 61 year old man. A syringe containing heroin. Altogether she was linked to forty separate crimes including six murders. Her accomplices included Slovaks, Iraqis, Serbs, Romanians and Albanians. This was an unprecedented case. A modern day Moriarty. She was called ‘The Phantom of Heilbronn’ or ‘The Woman Without a Face’.

Then in 2009 the police found her. After a case lasting eight years, 16,000 man hours and a cost of €2 million the police had their suspect. She was a technician working at the factory which made the cotton swabs the forensics team used to collect samples. As she had gone about her work moving and speaking her saliva and skin had got on the swabs and contaminated them. Police confirmed that every sample of the Phantom’s DNA had been collected with swabs from the same factory. The Phantom of Heilbronn did not exist.

If you think about it, it was incredibly unlikely that one woman was involved in so many different crimes across so many countries over so many years. It actually makes much more sense that it was error. And yet the investigators were blinded by the result in black and white on a screen.

This can happen in Medicine. A result from a blood test or imaging comes back positive or negative and we just accept it. We have use our brains and think about the tests we’re ordering and what the results mean.

Sensitivity

If you have a certain disease we want a test that will detect if you have it and come back positive. That is a test’s sensitivity. We don’t want false negatives: people with a disease not testing positive. A sensitivity of 100% means that the test will always come back positive if you have the disease. A sensitivity of 50% means that the test will correctly detect disease in 50% of patients with the disease. The other 50% get a false negative. Sensitivity is very important if you’re testing for a serious disease. For example, if you’re testing for cancer you don’t want many false negatives.

Specificity

As well as detecting disease you also want the test to accurately rule out a disease if the patient doesn’t have it. This is its specificity. We don’t want false positives: people who don’t have the disease testing positive. A specificity of 100% means that the test will always come back negative if you don’t have the disease. A specificity of 50% means that 50% of people who don’t have a disease will correctly test negative. The other 50% will be given a false positive result. Specificity is very important if there’s a potentially hazardous treatment or further investigation following a positive result. If a positive result means your patient has to undergo a surgical procedure or be exposed to radiation by a CT scan you’re going to want as few false positives as possible.

The trouble is that no test is 100% sensitive or 100% specific. This has to be understood. No result can be interpreted properly without understanding the clinical context.

public.jpeg

For example, the sensitivity of a chest x-ray for picking up lung cancer is about 75%. That means it gives a true positive for 3 out of 4 patients with the other patient getting a false negative. If your patient is in their twenties, a non-smoker with no family history and no symptoms other than a cough you’d probably accept that 1/4 chance of a false negative and be happy you’ve ruled out a malignancy unless the situation changes. However, in a patient in their seventies with a smoking history of over 50 years who’s coughing up blood and had unexplained weight loss suddenly that 75% chance of detecting cancer on a chest x-ray doesn’t sound so comforting. Even if you can’t see a mass on their chest x-ray you’d still refer them for more sensitive imaging. That’s because the second patient has a much higher probability of having lung cancer based on their history. So high in fact that choosing a test with such poor sensitivity as a chest x-ray might not be the right decision to make. This is where pre-test probability comes in.

Pre-test probability

This principle of understanding the clinical context is called the pre-test probability. Basically it is the likelihood the individual patient in front of you has a particular condition before you’ve even done the test for that condition.

The probability of the condition or target disorder, usually abbreviated P(D+), can be calculated as the proportion of patients with the target disorder, out of all the patients with the symptoms(s), both those with and without the disorder:

P(D+) = D+ / (D+ + D-)

(where D+ indicates the number of patients with target disorder, D- indicates the number of patients without target disorder, and P(D+) is the probability of the target disorder.)

Pre-test probability depends on the circumstances at that time. For example, the pre-test probability of a particular patient attending their GP with a headache having a brain tumour is 0.09%. Absolutely tiny. However, with every re-attendance with the same symptom or developing new symptoms or even then attending an Emergency Department, that pre-test probability goes up.

Pre-test probability helps us interpret results. It also helps us pick the right test to do in the first place.

Pulmonary embolism: a difficult diagnosis

Pulmonary embolism (blood clot on the lung) affects people of all ages, killing up to 15% of patients hospitalised with a PE. This is reduced by 20% if the condition is identified and treated correctly with anticoagulation. PE doesn’t play fair though and has very non-specific symptoms such as shortness of breath or chest pain. The gold standard for detecting or ruling out a PE is with a computerised tomography pulmonary angiogram (CTPA) scan. However, a CTPA scan involves exposing the chest and breasts to a lot of radiation. For instance, a 35 year old woman who has one CTPA scan has her overall risk of breast cancer increased by 14%. There’s also the logistical impossibility of scanning every patient we have. So we need a way of ensuring we don’t scan needlessly.

We do have a blood test, checking for D-Dimers which are the products of the body’s attempts to break down a clot. The trouble is other conditions such as infection or cancer can increase our D-Dimer as well. The D-Dimer test has a sensitivity of 95% and a specificity of 60%. That means that it will fail to detect PE in 5% of patients meaning we miss a potentially fatal disease in 1/20 patients with a PE. It also means it will fail to rule out PE in 40% of patients and so risk exposing patients without a PE to a scan which increases their risk of cancer. Not to mention starting anticoagulation treatment (and so increasing risk of bleeding such as as a brain haemorrhage) needlessly. So we have to be careful to only do the D-Dimer test in the right patients. This is why we need to work out our patient’s risk.

Luckily there is a risk score for PE called the Well’s Score. This uses signs, symptoms, the patient’s history and clinical suspicion and can stratify the patient as low or high risk for a PE. We then know the chances of whether the patient will turn out to have a PE based on whether they are low or high risk.

Only 12.1% of low risk patients will have a PE. At such a low chance of PE we accept the D-Dimer’s 5% probability of a false negative and are keen to avoid the radiation exposure of a scan and so do the blood test. If it is negative we accept that and consider PE ruled out unless the facts change. If it is positive we can proceed to imaging.

However, 37.1% of high risk patients will have a PE. Now it’s a different ballgame. The pre-test probability has changed. A high risk patient has a more than 1/3 chance of having a PE. Suddenly the 95% sensitivity of a D-Dimer doesn’t seem enough knowing there’s a 1/20 chance of missing a potentially fatal diagnosis. The patient is likely to deem the scan worth the radiation risk knowing they’re high risk. So in these patients we don’t do the D-Dimer. We go straight to imaging. If a D-Dimer has been done for some reason and is negative we ignore it and go to scan. We interpret the evidence based on circumstances and probability.

This is basis of the NICE guidance for suspected pulmonary embolism.

Grissom is wrong; the evidence can lie. Some of the results we get will be phantoms. Not only must we pick the right test we must also think: will I accept the result I might get?

Thanks for reading.

- Jamie

giphy.gif

#FOAMPubMed 4: p values

In the previous blog we looked at how Type I Error is the false rejection of a null hypothesis.

THE MAXIMUM CHANCE WE WANT OF FALSELY REJECTING OUR NULL HYPOTHESIS IS 5%

This is a gold standard.

WE THEREFORE DESIGN STUDIES TO HAVE A LESS THAN 5% CHANCE OF FALSELY REJECTING OUR NULL HYPOTHESIS

A p value is a decimal showing the probability of falsely rejecting the null hypothesis. It will usually be given in a paper along with the results.

As we want a chance of less than 5% of falsely rejecting our null hypothesis the p value we want is p<0.05

Some studies want an even smaller chance of Type I Error and so design their study for p=0.01 (1% chance of falsely rejecting the null hypothesis) for example.

The p value we want will help shape our study, including sample size.

With p<0.05 we will have significant results - more of that in the next blog

#FOAMPubMed 3: Type I Error

photo-1533988902751-0fad628013cb.jpeg

First things first, no piece of research is perfect.  Every study will have its limitations. 

One way we try to make research better is through understanding error.  

If we find that the new drug works when it doesn’t that’s called a false positive.  We can’t eliminate false positives; some patients will get better even if given placebo.  But too many false positives and we will find an effect when one doesn’t actually exist. We will wrongly reject our null hypothesis.  

Type I Error comes about when we wrongly reject our null hypothesis. 

This will mean that we will find our new drug is better than the standard treatment (or placebo) when it actually isn't.

Type I Error is also called alpha

A way I like to look at Type I Error is the influence of chance on your study. Some patients will get better just through chance. You need to reduce the impact of chance on your study.

For instance, I may want to investigate how psychic I am. My null hypothesis would be ‘I am not psychic.’

I toss a coin once. I guess tails. I’m right. I therefore reject my null hypothesis and conclude I’m psychic.

You don’t need to be an expert in research to see how open to chance that study is and how one coin toss can’t be enough proof. We’d need at least hundreds of coin tosses to see if I could predict each one.

You see how understanding Type I Error influences how you design your study, including your sample size

More of that later. The next blog will look at how we actually statistically show that we’ve reduced Type I Error in our study.

#FOAMPubMed 2: The null hypothesis

chaos-3098693__340.jpg


When we do research in Medicine it’s usually to test whether a new treatment works (by testing it against placebo) or better than the established treatment we’re already using.


At the beginning of our study we have to come up with a null hypothesis (denoted as H0).


The null hypothesis is a statement that assumes no measurable difference between whatever you’re studying.  


The null hypothesis is therefore usually something along the lines of: 

‘Drug A won’t be better than Drug B at treating this condition.’  

We then set out to test this null hypothesis.  If we find Drug A is better than B then we reject the null hypothesis and conclude Drug A is the superior treatment. If Drug A is found to be no better (i.e. the same or worse) than Drug B then we accept our null hypothesis and conclude that Drug A is non-superior (or inferior).


Error comes when we either wrongly reject or wrongly accept the null hypothesis.

Error means we come to the wrong conclusion. There are two types of error, the next blog will look at the first, Type I Error.

#FOAMPubMed 1: Lemons and Limes, the first clinical trial and how to make a research question

fruit-15408_960_720.jpg

Before we conduct any research we first need to construct a research question. This can be a difficult step. Our question needs to be precise and easy to understand. To do this we can use the ‘PICO’ criteria:

Population

We need a population of interest. These will be subjects who share particular demographics and needs to be clearly documented.

Intervention

The intervention is something you’re going to do to your population. This could be treatment or education or an exposure such as asbestos. The effect of the intervention is what you’re interested in.

Control/Comparison

If we’re going to study an intervention we need to compare it. We can use people without the exposure (control) or compare the treatment to another or placebo.

Outcome

The outcome is essentially what we are going to measure in our study. This could be mortality, it could be an observation such as blood pressure or a statistic such as length of stay in hospital. Whatever it is we need be very clear that this our main outcome, otherwise known as our primary outcome. The outcome decides our sample size so has be explicit.

PICO therefore allows us to form a research question.

To demonstrate this let’s look at the first ever clinical trial and see how we use PICO to write a research question.

It’s the 18th century. An age of empires, war and exploration. Britain, an island nation in competition with its neighbours for hegemony, relies heavily on her navy as the basis of her expansion and conquest. This is the time of Rule Britannia. Yet Britain, as with all sea going nations, was riddled with one scourge amongst its sailors: scurvy.

Scurvy is a disease caused by a lack of Vitamin C. Vitamin C, or ascorbic acid, is essential in the body to help catalyse a variety of different functions including making collagen, a protein which forms the building blocks of connective tissue, and wound healing. A lack of Vitamin C therefore causes a breakdown of connective tissue as well as impaired healing; this is scurvy, a disease marked by skin changes, bleeding, loss of teeth and lethargy. Hardly the state you want your military to be when you’re trying to rule the waves.

James Lind was born in Edinburgh in 1716. In 1731, he registered as an apprentice at the College of Surgeons in Edinburgh and in 1739 became a surgeon's mate, seeing service in the Mediterranean, Guinea and the West Indies, as well as the English Channel. In 1747, whilst serving on HMS Salisbury he decided to study scurvy and a potential cure.

James Lind 1716-1794

James Lind 1716-1794

Lind, as with medical opinion at the time, believed that scurvy was caused by a lack of acid in the body which made the body rot or putrefy. He therefore sought to treat sailors suffering with scurvy with a variety of acidic substances to see which was the best treatment. He took 12 sailors with scurvy and divided them into six pairs. One pair were given cider on top of their normal rations, another sea water, another vinegar, another sulphuric acid, another a mix of spicy paste and barley with another pair receiving two oranges and one lemon (citrus fruits containing citric acid).

Although they ran out of fruit after five days by that point one of the pair receiving citrus fruits had returned to active duty whilst the other was nearly recovered. Lind published his findings in his 1753 work, A treatise on scurvy. Despite this outcome Lind himself and the wider medical community did not recommend citrus fruits to be given to sailors. This was partly due to the impossibility of keeping fresh fruit on a long voyage and the belief that other easier to store acids could cure the disease. Lind recommended a condensed juice called ‘rob’ which was made by boiling fruit juice. Boiling destroys vitamin C and so subsequent research using ‘rob’ showed no benefit. Captain James Cook managed to circumnavigate the globe without any loss of life to scurvy. This is likely due to his regular replenishment of fresh food along the way as well as the rations of sauerkraut he provided.

It wasn’t until 1794, the year that Lind died, that senior officers on board the HMS Suffolk overruled the medical establishment and insisted on lemon juice being provided on their twenty three week voyage to India to mix with the sailors’ grog. The lemon juice worked. The organisation responsible for the health of the Navy, the Sick and Hurt Board, recommended that lemon juice be included on all voyages in the future.

Although his initial assumption was wrong, that scurvy was due to a lack of acid and it was the acidic quality of citrus fruits that was the solution, James Lind had performed what is now recognised as the world’s first clinical trial. Using PICO we can construct Lind’s research question.

Population

Sailors in the Royal Navy with scurvy

Intervention

Giving sailors citrus fruits on top of their normal rations

Comparison

Seawater, vinegar, spicy paste and barley water, sulphuric acid and cider

Outcome

Patient recovering from scurvy to return to active duty

So James Lind’s research question would be:

Are citrus fruits better than seawater, vinegar, spicy paste and barley water, sulphuric acid and cider at treating sailors in the Royal Navy with scurvy so they can recover and return to active duty?

After HMS Suffolk arrived in India without scurvy the Naval establishment began to give citrus fruits in the form of juice to all sailors. This arguably helped swing superiority the way of the British as health amongst sailors improved. It became common for citrus fruits to be planted across Empires by the Imperial countries in order to help their ships stop off and replenish. The British planted a particularly large stock in Hawaii. Whilst lemon juice was originally used the British soon switched to lime juice. Hence the nickname, ‘limey’.

A factor which had made the cause of scurvy hard to find was the fact that most animals can actually make their own Vitamin C, unlike humans, and so don’t get scurvy. A team in 1907 was studying beriberi, a disease caused by the lack of Thiamine (Vitamin B1), in sailors by giving guinea pigs their diet of grains. Guinea pigs by chance also don’t synthesise Vitamin C and so the team were surprised when rather then develop beriberi they developed scurvy. In 1912 Vitamin C was identified. In 1928 it was isolated and by 1933 it was being synthesised. It was given the name ascorbic (against scurvy) acid.

James Lind didn’t know it but he had effectively invented the clinical trial. He had a hunch. He tested it against comparisons. He had a clear outcome. As rudimentary as it was this is still the model we use today. Whenever we come up with a research question we are following the tradition of a ship’s surgeon and his citrus fruit.

Thanks for reading.

- Jamie

Medicine and Game Theory: How to win

board-game-1846400_960_720.jpg

You have to learn the rules of the game; then learn to play better than anyone else - Albert Einstein

Game theory is a field of mathematics which emerged in the 20th century looking at how players in a game interact. In game theory any interaction between two or more people can be described as a game. In this musing I’m looking at how game theory can influence healthcare both in the way we view an individual patient as well as future policy.

There are at least two kinds of games. One could be called finite, the other infinite. A finite game is played for the purpose of winning, an infinite game for the purpose of continuing the play.     

James P. Carse Author of Finite and Infinite Games

Game theory is often mentioned in sports and business

In a finite game all the players and all the rules are known. The game also has a known end point. A football match would therefore be an example of a finite game. There are two teams of eleven players with their respective coaches. There are two halves of 45 minutes and clear laws of football officiated by a referee. After 90 minutes the match is either won, lost or drawn and is definitely over.

Infinite games have innumerable players and no end points. Players can stop playing or join or be absorbed by other teams. The goal is not an endpoint but to keep playing. A football season or even several football seasons could be described as an infinite game. Key to infinite games then is a vision and principles. A team may lose one match but success is viewed by the team remaining consistent to that vision; such as avoiding relegation every season or promoting young talent. Athletic Club in Spain are perhaps the prime example of this. Their whole raison d'être is that they only use players from the Basque Region of Spain. This infinite game of promoting local talent eschews any short term game. In fact their supporters regularly report they’d rather get relegated than play non-Basque players.

Problems arise by confusing finite and infinite games. When Sir Alex Ferguson retired as Manchester United manager after 27 years in 2013 the club attempted to play an infinite game. They chose as his replacement David Moyes, a manager with a similar background and ethics to Ferguson, giving him a 9 year contract. 6 months into that he was fired and since then United have been playing a finite game choosing more short term appointments, Louis van Gaal and Jose Mourinho, rather than following a vision.

It’s easy to see lessons for business from game theory. You may get a deal or not. You may have good quarters or bad quarters. But whilst those finite games are going on you have your overall business plan, an infinite game. You’re playing to keep playing by staying in business.

What about healthcare?

So a clinician and patient could be said to be players in a finite game competing against whatever illness the patient has. In this game the clinician and patient have to work together and use their own experiences to first diagnose and then treat the illness. The right diagnosis is made and the patient gets better. The game is won and over. Or the wrong diagnosis is made and the patient doesn’t get better. The game is lost and over. But what about if the right diagnosis is made but for whatever reason the patient doesn’t get better? That finite game is lost. But what about the infinite game?

Let’s say our patient has an infection. That infection has got worse and now the patient has sepsis. In the United Kingdom we have very clear guidelines on how to manage sepsis from the National Institute of Clinical Excellence. Management is usually summed up as the ‘Sepsis Six’. There are clear principles about how to play this game. So we follow these principles as we treat our patient. We follow the Sepsis Six. But they aren’t guarantees. We use them because they give us the best possible chance to win this particular finite game. Sometimes it will work and the patient will get better and we win. Sometimes it won’t and the patient may die. Even if all the ‘rules’ are followed, due to reasons beyond any of the players. But whilst each individual patient may be seen as a finite game there is a larger infinite game being played. By making sure we approach each patient with these same principles we not only give them the best chance of winning their finite game but we also keep the infinite game going; of ensuring each patient with sepsis is managed in the same optimum way. By playing the infinite game well we have a better chance of winning finite games.

This works at the wider level too. For example, if we look at pneumonia we know that up to 70% of patients develop sepsis. We know that smokers who develop chronic obstructive pulmonary disease (COPD) have up to 50% greater risk of developing pneumonia. We know that the pneumococcal vaccine has reduced pneumonia rates especially amongst patients in more deprived areas. Reducing smoking and ensuring vaccination are infinite game goals and they work. This is beyond the control of one person and needs a coordinated approach across healthcare policy.

wood-100181_960_720.jpg

Are infinite games the future of healthcare?

In March 2015 just before the UK General Election the Faculty of Public Health published their manifesto called ‘Start Well, Live Better’ for improving general health. The manifesto consisted of 12 points:

The Start Well, Live Better 12 priorities from Lindsey Stewart, Liz Skinner, Mark Weiss, John Middleton, Start Well, Live Better—a manifesto for the public's health, Journal of Public Health, Volume 37, Issue 1, March 2015, Pages 3–5,

There’s a mixture of finite goals here - establishing a living wage for example - and some infinite goals as well such as universal healthcare. The problem is that finite game success is much more short-term and easier to measure than with infinite games. We can put a certain policy in place and then measure impact. However, infinite games aimed improving a population’s general health take years if not decades to show tangible benefit. Politicians who control healthcare policy and heads of department have a limited time in office and need to show benefits immediately. The political and budgetary cycles are short. It is therefore tempting to choose to play finite games only rather than infinite.

The National Health Service Long Term Plan is an attempt to commit to playing an infinite game. The NHS England Chief Simon Stevens laid out five priorities for the NHS focusing health spending over the next 5 years: mental health, cardiovascular disease, cancer, child services and reducing inequalities. This comes after a succession of NHS plans since 2000 which all focused on increasing competition and choice. The Kings Fund have been ambivalent about the benefit those plans made.

Since its inception the National Health Service has been an infinite game changing how we view illness and the relationship between the state and patients. Yet if we chase finite games that are incongruous to our finite game we risk that infinite game. There is a very clear link between the effect of the UK government’s austerity policy on social care and its impact on the NHS.

We all need to identify the infinite game we want to play and make sure it fits our principles and vision. We have to accept that benefits will often be intangible and appreciate the difficulties and scale we’re working with. We then have to be careful with the finite games we choose to play and make sure they don’t cost us the infinite game.

Playing an infinite game means committing to values at both a personal and institutional level. It says a lot about us and where we work. It means those in power putting aside division and ego. Above all it would mean honesty.

Thanks for reading

- Jamie

"Obviously a major malfunction" - how unrealistic targets, organisational failings and misuse of statistics destroyed Challenger

AP8601281739-1.jpg

There is a saying commonly misattributed to Gene Kranz the Apollo 13 flight director: failure is not an option. In a way that’s true. Failure isn’t an option. I would say it’s inevitable in any complicated system. Most of us work in one organisation or another. All of us rely on various organisations in our day to day lives. I work in the National Health Service, one of 1.5 million people. A complex system doing complex work.

In a recent musing I looked at how poor communication through PowerPoint had helped destroy the space shuttle Columbia in 2003. That, of course, was the second shuttle disaster. In this musing I’m going to look at the first.

This is the story of how NASA was arrogant; of unrealistic targets, of disconnect between seniors and those on the shop floor and of the misuse of statistics. It’s a story of the science of failure and how failure is inevitable. This is the story of the Challenger disaster.

”An accident rooted in history”

It’s January 28th 1986 at Cape Canaveral, Florida. 73 seconds after launching the space shuttle Challenger explodes. All seven of its crew are lost. Over the tannoy a distraught audience hears the words, “obviously a major malfunction.” After the horror come the questions.

The Rogers Commission is formed to investigate the disaster. Amongst its members are astronaut Sally Ride, Air Force General Donald Kutyna, Neil Armstrong, the first man on the moon, and Professor Richard Feynman; legendary quantum physicist, bongo enthusiast and educator.

The components of the space shuttle system (From https://www.nasa.gov/returntoflight/system/system_STS.html)

The shuttle programme was designed to be as reusable as possible. Not only was the orbiter itself reused (this was Challenger’s tenth mission) but the two solid rocket boosters (SRBs) were also retrieved and re-serviced for each launch. The cause of the Challenger disaster was found to be a flaw in the right SRB. The SRBs were not one long section but rather several which connected with two rubber O-rings (a primary and a secondary) sealing the join. The commission discovered longstanding concerns regarding the O-rings.

In January 1985 following a launch with the shuttle Discovery soot was found between the O-rings indicating that the primary ring hadn’t maintained a seal. At that time the launch had been the coldest yet at about 12 degrees Celsius. At that temperature the rubber contracted and became brittle making it harder to maintain a seal. On other missions the primary ring was nearly completely eroded through. The flawed O-ring design had been known about since 1977 leading the commission to describe Challenger, “an accident rooted in history.”

The forecast for the launch of Challenger would break the cold temperature record of Discovery: -1 degrees Celsius. On the eve of the launch engineers from Morton Thiokol alerted NASA managers of the danger of O-ring failure. They advised waiting for a warmer launch day. NASA however pushed back and asked for proof of failure rather than proof of safety. An impossibility.

“My God Thiokol, when do you want me to launch? Next April?”

Lawrence Molloy, SRB Manager at NASA

NASA pressed Morton Thiokol managers to go over their engineers and approve launch. On the morning of the 28th the forecast was proved right and the launch site was covered with ice. Reviewing launch footage the Rogers Commission found that in the cold temperature O-rings on the right SRB had failed to maintain a seal. 0.678 seconds into the launch grey smoke was seen escaping the right SRB. Due to ignition the SRB casing expanded slightly and the rings should have moved with the casing to maintain the seal. However, at minus one degrees Celsius they were too brittle and failed to do so. This should have caused Challenger to explode on the launch pad but aluminium oxides from the rocket fuel filled the damaged joint and did the job of the O-rings by sealing the site. This temporary seal allowed the Challenger to lift off.

This piece of good fortune might have allowed Challenger and its crew to survive. Sadly, 58.788 seconds into the launch Challenger hit a strong wind sheer which dislodged the aluminium oxide. This allowed hot air to escape and ignite. The right SRB burned through its joint to the external tank, coming loose and colliding with it. This caused a fireball which ignited the whole stack.

Challenger disintegrated and the crew cabin was sent into free fall before crashing into the sea. When the cabin was retrieved from the sea bed the personal safety equipment of three of the crew had been activated suggesting they survived the explosion but not the crash into the sea. The horrible truth is that it is possible they were conscious for at least a part of the free fall. Two minutes and forty five seconds.

So why the push back from NASA? Why did they proceed when there were concerns about the safety of the O-rings? This is where we have to look at NASA as an organisation arrogantly assumed it could guarantee safety. This included its own unrealistic targets.

NASA’s unrealistic targets

NASA had been through decades of boom and bust. The sixties had begun with them lagging behind the Soviets in the space race and finished with the stars and stripes planted on the moon. Yet the political enthusiasm triggered by President Kennedy and the Apollo missions had dried up and with it the public’s enthusiasm also waned. The economic troubles of the seventies were now followed by the fiscal conservatism of President Reagan. The money had dried up. NASA managers looked to shape the space programme in a way to fit the new economic order.

First, space shuttles would be reusable. Second, NASA made bold promises to the government. Their space shuttles would be so reliable and easy to use there would be no need to spend money on any military space programme; instead give the money to NASA to launch spy satellites. In between any government mission the shuttles would be a source of income as the private sector paid to use them. In short, the shuttle would be a dependable bus service to space. NASA promised that they could complete sixty missions a year with two shuttles at any one time ready to launch. This promise meant the pressure was immediately on to perform.

Four shuttles were initially built: Atlantis, Challenger, Columbia and Discovery. The first shuttle to launch was Columbia on 12th April 1981, one of two missions that year. In 1985 nine shuttle missions were completed. This was a peak that NASA would never exceed. By 1986 the target of sixty flights a year was becoming a monkey on the back of NASA. STS-51-L’s launch date had been pushed back five times due to bad weather and the previous mission itself being delayed seven times. Delays in that previous mission were even more embarrassing as Congressman Bill Nelson was part of the crew. Expectation was mounting and not just from the government.

Partly in order to inspire public interest in the shuttle programme the ‘Teacher in Space Project’ had been created in 1984 to carry teachers into space as civilian members of future shuttle crews. From 11,000 completed applications one teacher, Christa McAuliffe from New Hampshire was chosen to fly on Challenger as the first civilian in space. She would deliver two fifteen minute lessons from space to be watched by school children in their classrooms. The project worked. There was widespread interest in the mission with the ‘first teacher in space’ becoming something of a celebrity. It also created more pressure. McAuliffe was due to deliver her lessons on Day 4 of the mission. Launching on 28th January meant Day 4 would be a Friday. Any further delays and Day 4 would fall on the weekend; there wouldn’t be any children in school to watch her lessons. Fatefully, the interest also meant 17% of Americans would watch Challenger’s launch on television.

NASA were never able to get anywhere close to their target of sixty missions a year. They were caught out by the amount of refurbishment needed after each shuttle flight to get the orbiter and solid rocket boosters ready to be used again. They were hamstrung immediately from conception by an unrealistic target they never should have made. Their move to inspire public interest arguably increased demand to perform. But they had more problems including a disconnect between senior staff and those on the ground floor.

Organisational failings

During the Rogers Commission NASA managers quoted that the risk of a catastrophic accident (one that would cause loss of craft and life) befalling their shuttles was 1 in 100,000. Feynman found this figure ludicrous. A risk of 1 in 100,000 meant that NASA could expect to launch a shuttle every day for 274 years before they had a catastrophic accident. The figure of 1 in 100,000 was found to have been calculated as a necessity; it had to be that high. It had been used to reassure both the government and astronauts. It had also helped encourage a civilian to agree to be part of the mission. Once that figure was agreed NASA managers had worked backwards to make sure that the safety figures for all the shuttle components combined to make an overall risk of 1 in 100,000. NASA engineers knew this to be the case and formed their own opinion of risk. Feynman spoke to them directly. They perceived the risk at somewhere between 1 in 50 and 1 in 200. Assuming NASA managed to launch sixty missions a year that meant their engineers expected a catastrophic accident somewhere between once a year to once every three years. As it turned out the Challenger disaster would occur on the 25th shuttle mission. There was a clear disengagement between the perceptions of managers and those with hands on experience regarding the shuttle programme’s safety. But there were also fundamental errors when it came to calculating how safe the shuttle programme was.

Misusing statistics

One of those safety figures NASA included in their 1 in 100,000 figure involved the O rings responsible for the disaster. NASA had given the O rings a safety factor of 3. This was based on test results which showed that the O rings could maintain a seal despite being burnt a third of the way through. Feynman again tore this argument apart. A safety factor of 3 actually means that something can withstand conditions three times those its actually designed for. He used the analogy of a bridge built to only hold 1000 pounds being able to hold a 3000 pound load as showing a safety factor of 3. If a 1000 pound truck drove over the bridge and it cracked a third of a way through then the bridge would be defective, even if it managed to still hold the truck. The O rings shouldn’t have burnt through at all. Regardless of them still maintaining a seal the test results actually showed that they were defective. Therefore the safety factor for the O rings was not 3. It was zero. NASA misused the definitions and values of statistics to ‘sell’ the space shuttle as safer that it was. There was an assumption of total control. No American astronaut had ever been killed on a mission. Even when a mission went wrong like Apollo 13 the astronauts were brought home safely. NASA were drunk on their reputation.

Aftermath

The Rogers Commission Report was published on 9th June 1986. Feynman was concerned that the report was too lenient to NASA and so insisted his own thoughts were published as Appendix F. The investigation into Challenger would be his final adventure; he was terminally ill with cancer during the hearing and died in 1988. Sally Ride would also be part of the team investigating the Columbia disaster; the only person to do so. After she died in 2012 Kutyna revealed she had been the person discretely pointing the commission in the correct direction of the faulty O-rings. The shuttle programme underwent a major redesign and it would be two years before there was another mission.

Sadly, the investigation following the Columbia disaster found that NASA had failed to learn lessons from Challenger with similar organisational dysfunction. The programme was retired in 2011 after 30 years and 133 successful missions and 2 tragedies. Since then NASA has been using the Russian Soyuz rocket programme to get to space.

The science of failure

Failure isn’t an option. It’s inevitable. By its nature the shuttle programme was always experimental at best. It was wrong to pretend otherwise. Feynman would later compare NASA’s attitude to safety to a child believing that running across the road is safe because they didn’t get run over. In a system of over two million parts to have complete control is a fallacy.

We may not all work in spaceflight but Challenger and then Columbia offer stark lessons in human factors we should all learn from. A system may seem perfect because its imperfection is yet to be found, or has been ignored or misunderstood.

The key lesson is this: We may think our systems are safe, but how will we really know?

"For a successful technology, reality must take precedence over public relations,

for Nature cannot be fooled."

Professor Richard Feynman